Author The Lilly Commercial Team

Welltower To Buy Amica Retirement Home Chain From Ontario Teachers’ For $4.6 Billion
Welltower, a publicly traded real estate investment trust based in the United States, agreed to buy the Amica Senior Lifestyles chain from the Ontario Teachers’ Pension Plan as demand rises across Canada for retirement homes.
The Toledo, Ohio-based seniors living company, said it will pay the pension fund $4.6 billion, or approximately 3.2 billion United States dollars, for the chain’s 31 ultra-luxury Amica-branded retirement complexes in Toronto, Vancouver and Victoria, British Columbia. Welltower said the negotiated price represents “a substantial discount to estimated replacement cost” for the properties.
Welltower also said the deal includes seven properties under construction that are valued $1.25 billion as well as nine projects in the permit process valued at $150 million. As part of the pending deal, Welltower said it will also acquire a minority interest in Amica’s management team.
The transaction is just the latest of its kind for Welltower and occurs at a time when occupancy rates have risen in Canadian retirement home operations after dipping significantly during the recent pandemic. Demand for retirement homes in Canada is expected to further rise as the seniors population grows and new retirement home construction projects has slowed.
CBRE said in its latest report on valuations in that sector that institutional investors are starting to return while private buyers are expanding their portfolios.
The deal requires regulatory approvals and is expected to close in the fourth quarter. Welltower said that as part of the deal it will take over $560 million of Canada Mortgage and Housing Corp.-insured debt with an average interest rate of 3.6%.
“Construction starts remain at historic lows as a share existing inventory. While conditions appear ripe for new development in the sector, persistent high construction costs make the case for investment in existing projects that much stronger at this time,” said the real estate company in a report last month.
Bank of Montreal analysts initiated coverage on publicly-traded seniors housing companies this year in a report about baby boomers lifting the sector.
“With pandemic disruptions firmly in the rearview mirror and an aging population now upon us, we believe an attractive supply/demand picture will help drive a multi-year period of above-average organic growth,” said the analysts in a report. “The boomers are here—demographic tailwinds will support demand for year. As baby boomers age, growth in Canada’s seniors population is materially accelerating. Individuals aged 75+ are expected to reach circa 5.3 million people over the next 10 years.”
Shankh Mitra, Welltower’s CEO since 2020, said the Amica properties offer upside potential.
“Against a backdrop of rapidly growing demand and limited new supply, we expect the portfolio to drive outsized revenue and cash flow growth in the coming years,” he said in a statement.
“For the last 15 years, Ontario Teachers’ has acted as an extension of our internal team,” Amica’s Ezer said in a statement.
Welltower has been involved in other Canadian retirement home properties.
In October 2023, Welltower purchased 12 retirement homes in Quebec from Cogir for $885 million and soon after announced an agreement to divide a portfolio of seniors properties it held in partnership with Canadian retirement home firm Chartwell that left Welltower with 23 operations and Chartwell 16, along with a payment of $97.2 million to Chartwell.
The OTTP listed assets of $255.8 billion in its most recent tally made midway through 2024. Its real estate holdings, managed through its Cadillac Fairview subsidiary, were valued at just over 10% of the pension fund’s holdings, with 68 properties across Canada assessed at $28 billion. The OTTP’s largest recent transaction prior to the Amica sale took place last October when the pension fund purchased its partner TD’s 50% stake in the CF Carrefour Laval shopping centre in Laval, Quebec for $553 million.
Source CoStar. Click here for the full story.

North American Office Markets Take Different Paths After Emerging From Under Pandemic Cloud
As we approach the fifth anniversary of the COVID-19 shutdown, it is worth assessing how North American office markets have since evolved. While Canada and the U.S. saw an appreciable increase in office availability following the pandemic, the relative increases have been worse in this country.
Canadian office availability increased by over 60% compared to pre-pandemic levels, compared to about a 40% increase in the United States. Note that Canada’s current office availability rate of 12.2% is still lower than the U.S. at 16.1%, but Canada has moved further away from its long-term equilibrium, which has always been lower than the U.S. due to structural supply and demand differences between the two countries.

Part of the reason office availability has increased comparatively more in Canada might be due to higher work-from-home/hybrid work rates for office employees following the pandemic. A 2023 study in The Economist magazine found that Canada has the world’s highest work-from-home/hybrid work rate. The report noted the difference may reflect structural factors, including climate, housing affordability, comparatively long and congested commuting times, and ineffective transit in some of Canada’s major urban areas like Toronto. This combination of factors resulted in Canada experiencing a bigger erosion in office utilization rates than the U.S. over the past five years.
The supply side is another major factor explaining why office availability is higher in Canada. Over the past several years, Canada has been building more new office space than it typically has relative to the U.S. While tenants have been solid in leasing this new office space, backfilling the older space vacated by the tenants has been less successful, given their clear preference for newer buildings. This also contributes to a proportionately greater increase in total available office space in Canada.
Meanwhile, some cities in the U.S. are beginning to face a possible shortage of the type of first-generation new office space that is most in demand. This could kick off a new development cycle earlier than in Canada, where intentions to build more office space are virtually non-existent.

To be sure, Canada and the U.S. are now experiencing a similar recovery in office leasing volumes, perhaps reflecting return to the office (RTO) work strategies recently adopted by some firms. Although leasing volumes are well off their pandemic lows, neither country has returned to the office leasing levels typically achieved before the pandemic. This is especially true in Canada since the downturn in leasing activity relative to pre-pandemic levels was comparatively deeper than in the U.S.

Despite the pandemic having a slightly worse impact on Canada’s office market fundamentals over the past five years, the situation in the office investment market tells a different story. Over the past five years, office market capitalization rates increased more sharply in the U.S. compared to Canada. For example, U.S. office cap rates have historically been 100 basis points higher than Canada’s (a basis point is one-hundredth of one percent). However, by the end of 2024, the relative “discount” in U.S. cap rates to Canada widened to 130 basis points.

While part of the increase in U.S. cap rates reflected eroding space market fundamentals, the widening discount to Canada was primarily due to capital market forces. Office ownership in the U.S. is more fragmented than in Canada, with merchant builders and small investors representing a larger market share. Since these investors typically employ significant debt in their capital structures, the relative rise in the cost of capital as interest rates increased during the post-pandemic period forced many U.S. office owners to take write-downs and even resulted in some distressed sales. In reaction to this distress, U.S. market cap rates rose accordingly.
In contrast, a comparatively higher percentage of well-capitalized institutions, such as pension funds, own office properties in Canada. Most are equity investors who use very little debt in their capital structure. As a result, many of these owners have felt little pressure from the capital markets to sell or even “mark-to-market” asset values despite a similar, if not worse, erosion in space market fundamentals than the U.S. over the past five years.
With the Bank of Canada cutting interest rates more aggressively than the U.S. Federal Reserve, some Canadian office owners may also be hoping that Canada’s relative cost of capital will sharply fall and ultimately preserve their property valuations.
Interestingly, these capital market dynamics may be a key reason why office investment transactions are beginning to evolve differently in Canada and the U.S.
While neither market has seen office investment transactions recover to pre-pandemic levels, a faster recovery appears to be taking hold in the U.S. In 2024, the U.S. office market recorded $42 billion in sales, a nearly 20% increase from the year before. Even more telling, sales quickened as the year unfolded, with fourth-quarter sales volume surging 63% over the same period in 2023. According to some investors, the reawakening in office transactions reflects the growing opportunity to buy properties with great long-term fundamentals at attractive pricing before a full recovery sets in.

In contrast, office sales remain near all-time lows in Canada, particularly for larger assets and portfolios. The vast majority of building sales, if any, have tended to be small suburban properties or transactions initiated by an end-user such as a school or local government. The main reason for the lack of trading appears to be a lack of liquidity in the market, as potential buyers and sellers in Canada still have widely different expectations about office property pricing in the private market.
This situation could devolve into a vicious circle. Fewer office trades mean fewer sales comps and continued uncertainty about pricing and valuations, leading to fewer sales.
Unfortunately, five years after the pandemic, investor uncertainty in Canada could become magnified further due to a potential trade war with the U.S. As a result, Canada’s elusive office investment recovery will likely continue diverging from its neighbor to the south for the foreseeable future.
Source CoStar. Click here for the full story.

Real Estate Holdings Weigh Down Ontario Teachers’ Performance
Ontario Teachers’ Pension Plan says it achieved solid financial growth in 2024, but its real estate holdings played a role in one the country’s largest pension funds missing its benchmark return rate.
Ontario Teachers’ said its one-year total fund net return last year was 9.4% compared to 1.9% in 2023. It also said its net assets grew to $266.3 billion, up from $247.5 billion in 2023.
Despite the return, the results did not meet the benchmark, or target, return of 12.9% for 2024, Ontario Teachers’ said. The pension fund released its annual results on Thursday.
“The benchmark underperformance was primarily attributed to assets in private equity and real estate trailing their respective benchmarks,” the pension fund said.
Ontario Teachers’ did say that one of its 2024 property highlights was expanding its logistics real estate portfolio across Europe, where it acquired eight fully leased logistics assets in France and three warehouses in Germany.
The Toronto-based pension fund had assets of $266.3 billion as of Dec. 31 and 343,000 working members and pensioners. It owns 100% of Cadillac Fairview Corp., one of the country’s largest real estate companies.
“We had positive contributions from across the plan, with notable success in venture growth, credit, inflation-sensitive and public equity investments. The resilience of our portfolio, combined with our proactive approach to creating value, has positioned us strongly in an unpredictable economic climate,” said Jo Taylor, president and CEO of the pension fund, in a statement. “Our investment portfolio is well placed to deliver strong risk-adjusted returns for the plan in 2025 and meet our long-term obligations to the members we serve.”
Real estate had a negative 0.7% return, well below the 5% target rate for 2024. It was the second consecutive year of underperformance by the pension fund’s real estate holdings. In 2023, its real estate return was negative 5.9% versus a benchmark of a 2%.
Source CoStar. Click here for the full story.

Canada’s Largest Pension Fund To Sell Its Headquarters
Canada Pension Plan Investment Board said it retained CBRE to sell its head office complex in downtown Toronto, a move that comes after the country’s largest pension fund announced it would move its global headquarters next year.
CBRE’s offering is for a 100% freehold interest in 1 Queen St. East and 20 Richmond St. East, a two-building office complex that contains 503,930 square foot of space and occupies a full city block.
Marketing materials obtained by CoStar News said the property offers potential buyers “a transformative opportunity to reimagine an iconic office complex in the heart of Toronto’s financial core.”
CPP Investments, the group that manages the Canada Pension Plan on behalf of 22 million contributors and beneficiaries, plans to relocate to 330,000 square feet in the second tower in CIBC Square at 141 Bay St.
The 50-storey tower is a joint development project between Montreal-based Ivanhoé Cambridge and Houston-based Hines that broke ground in 2021. It is expected to be completed in July, according to CoStar data.
CPP Investments said it will continue to anchor its current complex until it moves into its new head office next year. The complex includes a 398,527 square foot 26-storey tower on Queen and a 105,403 low-rise office property on Richmond that was constructed in 1893 and has heritage importance.
The two buildings are connected by a five-storey glass atrium, ground and concourse retail, and a four-level parking garage.
High-profile location
CBRE noted the complex is located at Yonge Street and Queen Street, a high-profile corner connected to Toronto’s underground PATH system and two subway stations that will include connections to the new Ontario Line, scheduled to open in 2031.
The complex has flexibility that permits residential redevelopment and hospitality conversion concepts.
“The mixed-use official plan designation and strong precedence of high-rise residential developments in the immediate node support compelling site densification strategies,” CBRE said in its flyer.
In 2013, CPP Investments said it acquired 100% of 1 Queen Street East and the adjoining 20 Richmond Street East from the Ontario Pension Board for $220 million.
Excluding CPP Investments, 1 Queen is 9.6% occupied and 20 Richmond is 27.3% occupied.
Officials with CPP Investments declined to comment.
Source CoStar. Click here for the full story.

Allied Properties Reit Optimistic About Office Sector
Allied Properties Real Estate Investment Trust, one of Canada’s largest office REITs, said it is increasingly optimistic about demand for space in its buildings, even as it is being urged to cut its distribution to shore up its balance sheet.
“I want to reiterate my confidence that our portfolio will continue to hold up well in this economic environment,” Allied President and CEO Cecilia Williams told investors last week during its fourth-quarter earnings call. “Yes, we are aware of the headwinds, but we see more upside and are optimistic because of the strength of our operating platform.”
Still, Pammi Bir, managing director of real estate and REITs at RBC Capital Markets, asked Allied executives for their rationale for holding the shareholder distribution at current levels instead of lowering them. Bir said that “a cut could certainly help concerning achieving some of your debt reduction targets.”
Williams quickly shot down the idea of a distribution reduction.
“Our distribution is a commitment that we have made with our investors, and we take it very seriously,” Williams said on the call. “And we have a path to be able to strengthen the balance sheet without having to cut the distribution, which is why we are not cutting it.”
Allied announced its earnings for the quarter that ended Dec. 31 in a challenging environment for the country’s office market. The headwinds affected the REIT’s, funds from operation, during the quarter. FFO is a significant indicator of financial performance for real estate investment trusts.
Key indicator drops
In the quarter, Allied’s funds from operations totalled nearly $72.4 million down 15.3% from a year earlier. On a per-unit basis, FFO was 51.8 cents in the fourth quarter versus 61.1 cents a year earlier. The REIT’s FFO payout ratio jumped to 86% from 73.6% during the period.
Analysts with Canaccord Genuity said the drop in FFO is putting additional focus on the REIT’s “elevated” payout ratio. The payout ratio represents the amount of a company’s FFO that is paid out as distributions.
“Allied Properties REIT’s financial results highlight a continued challenging operating environment for office landlords. Results were below expectations, and while management expressed confidence that occupancy will improve in 2025, market fundamentals are not expected to improve materially in the next year,” Canaccord analysts said in their report.
As for its 14.5 million square feet portfolio, Allied said its occupied and leased area was 85.9% and 87.2%, respectively in the fourth quarter. Allied also said it renewed 69% of leases maturing in the quarter, close to its historical average of 70% to 75%.
Allied’s goal for year-end 2025 is to have 90% of space occupied and leased.
TD Cowen analysts said the expectation of a 4% drop in FFO was unsurprising given the REIT’s issues and said 2025 will be the tough for Allied earnings.
“We are encouraged by the optimism management has in the current leasing environment, the TD Cowen analysts said in a report. “We believe the cadence of 2025 occupancy gains towards the 90% target, more weighted to the second half (of 2025), will be the key driver of near-term stock performance.”
Source CoStar. Click here for the full story.
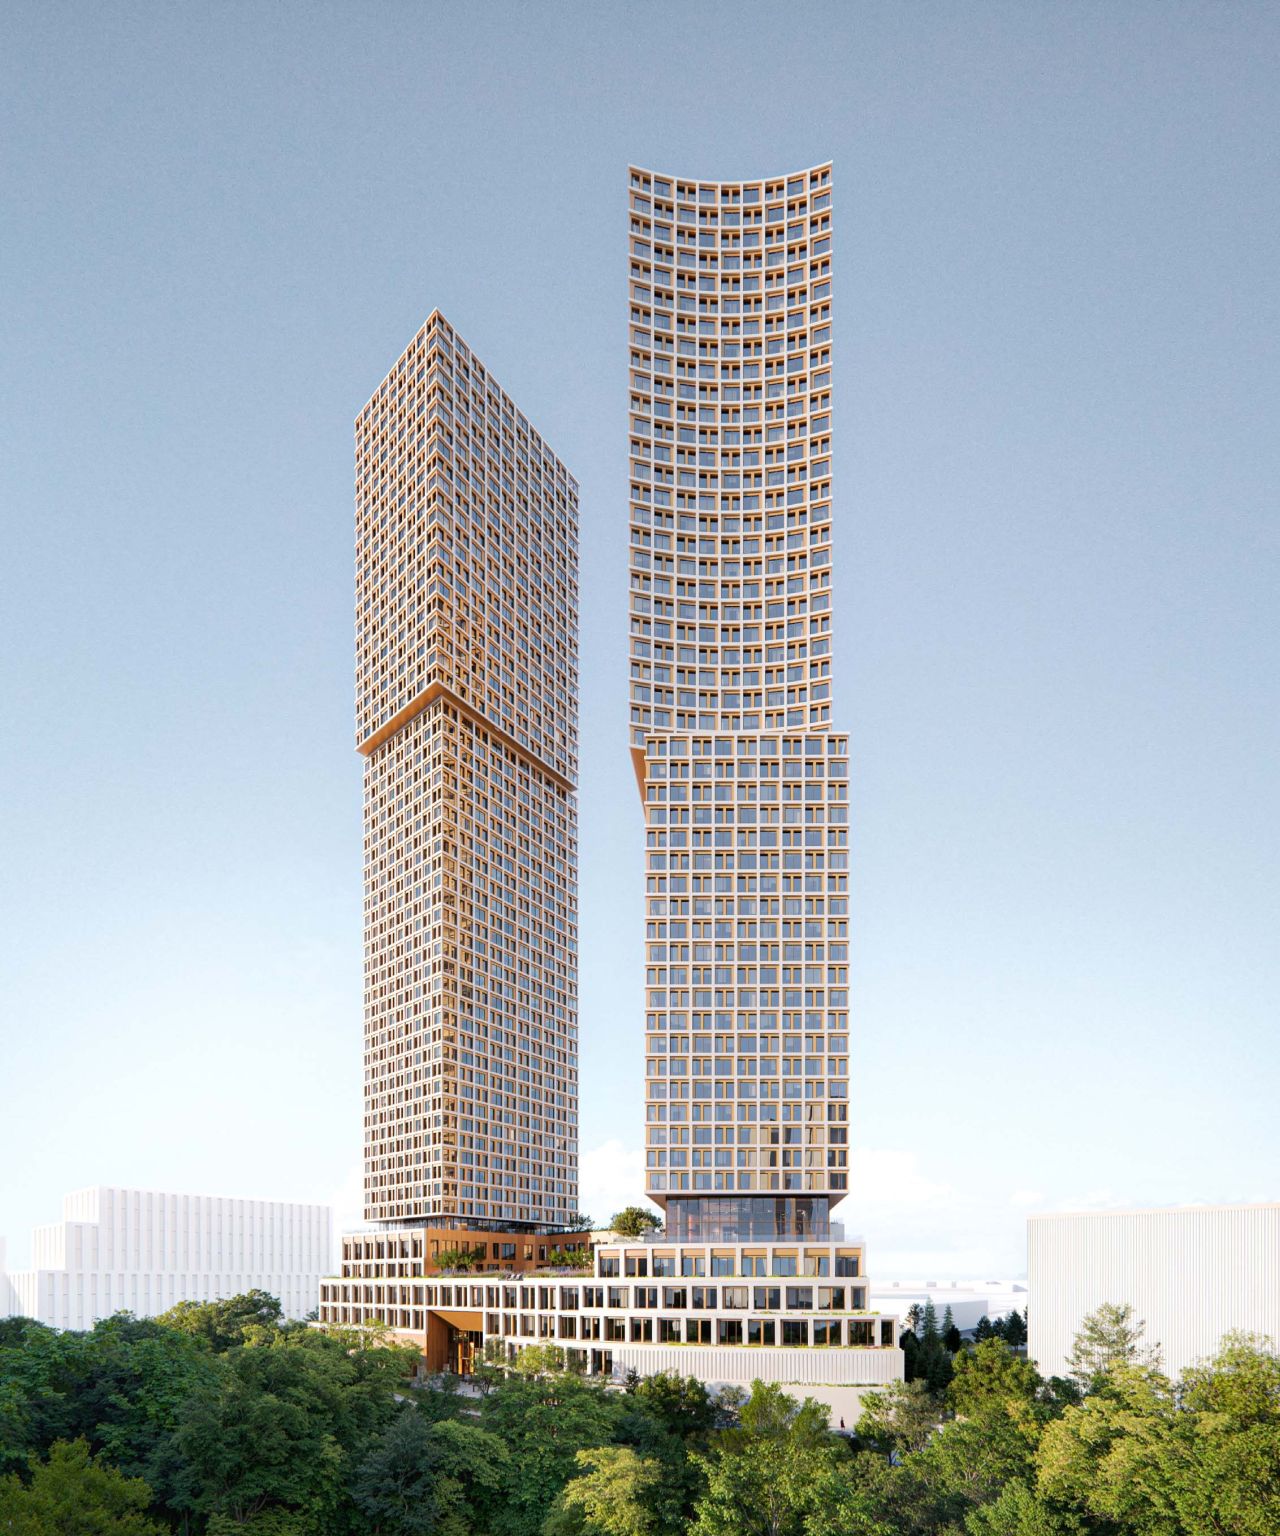
Mixed-Use Towers to Extend Vaughan Metropolitan Centre Northward
The transformation of the area around Vaughan Metropolitan Centre station continues with a new proposal at 60 Talman Court, somewhat to the north of where redevelopment of this commercial and industrial area has been taking place so far. The submission from MPAR Developments calls for two high-rise towers of 50 and 55 storeys. Designed by SvN, the mixed-use development would include residential units alongside a hotel, office space, a medical office, and retail space.
The site spans 8,582m² at the southwest corner of MacIntosh Boulevard and Talman Court, just east of Jane Street. Currently, it is occupied by a one-storey commercial building and surface parking. The surrounding neighbourhood is a mix of low-rise commercial buildings, employment areas, and natural spaces. To the west lies the Black Creek corridor. Edgeley Pond and Park sits to the southwest.
 An aerial view of the site in red and surrounding area, image from submission to City of Vaughan
The site is about 300m north of the Vaughan Metropolitan Centre boundary. The developer has submitted Official Plan Amendment and Zoning By-law Amendment applications to the City of Vaughan for towers rising 167.5m and 183.5m high from a tiered 4 to 6-storey podium. The development would deliver 933 residential units, with 438 market-rate rentals and 495 condominiums.
 Context plan, designed by SvN for MPAR Developments
The project also includes a 225-room hotel alongside office and medical office spaces. The total Gross Floor Area is 90,485m², resulting in a Floor Space Index of 11.18 times lot coverage. Residential uses account for 73,029m², while the hotel spans 13,076m². Office and medical spaces total 3,865m², with 364m² allocated for retail at grade.
 Proposed uses and programming, image from submission to City of Vaughan
The hotel would occupy space from the first up to the sixth floor, while the office space housed on the third floor, with medical offices on the fourth floor. The Elspeth Heyworth Centre for Women is expected to occupy the dedicated office space.
 An aerial view looking west to the podium, designed by SvN for MPAR Developments
Five residential elevators per tower would result in an elevator ratio of one for every 93 units. The hotel would have four elevators, while the office space would be served by three. Below grade, plans for five levels of underground parking include 379 spaces for residents, 140 for visitors, 32 for office, and 59 for the hotel, with three spaces for retail. Bicycle parking provisions entail 810 long-term and 211 short-term spaces for residents and additional allocations of 46 for the hotel, 42 for the offices, and 14 for retail.
 Ground floor plan, designed by SvN for MPAR Developments
Open space elements would include a 491m² public park at the north end of the site, with 385m² of unencumbered parkland. POPS (Privately-Owned Publicly-accessible Space) would be distributed across the south and west ends, creating connections to 8083 Jane Street, proposed for a high-rise development also designed by SvN for MPAR. The design also anticipates future integration with a multi-use path network, supporting Vaughan’s long-term plans for active transportation and green connections along the Black Creek Corridor.
 Site plan, designed by SvN for MPAR Developments
VMC station and SmartVMC Bus Terminal are located 800m to the south, which is a short bus ride, about a 4-minute drive, or a 20-minute walk. The station provides access to TTC’s University Line 1 subway, York Region Transit (YRT) bus routes, and others. Rutherford GO station, 6km away, offers regional train and bus connections. Cycling infrastructure in Vaughan is expanding, with Jane Street set to feature new cycle tracks.
 Looking west to the current site, image retrieved from Google Maps
The surrounding area is experiencing significant high-rise development activity. To the north, 8083 Jane Street is planned as four towers ranging from 8 to 60 storeys. Southwest, 201 and 175 Millway propose four towers up to 45 and three up to 64 storeys, respectively. Closer to VMC station, major projects underway include ArtWalk District Phase 1, with three towers up to 38 storeys, and the 60-storey CG Tower. Other notable proposals include dual 40-storey towers at 2966-2986 Highway 7, a five-tower plan at 2951 Highway 7 reaching 48 storeys, and 7800 Jane, with three towers ranging from 17 to 60 storeys. The masterplanned community at 3131 Highway 7 envisions 17 towers up to 74 storeys.
Source Urban Toronto. Click here for the full story.

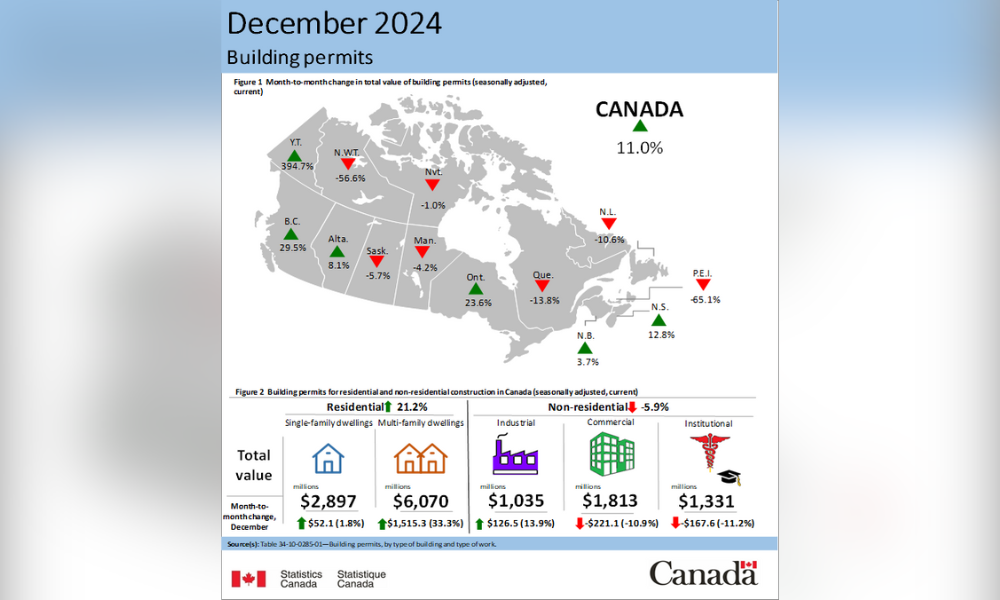
Canada’s Building Permits Hit Seven-year High
Canada’s building permit activity ended 2024 on a high note, with the total value of permits reaching their highest level since 2017.
Statistics Canada reported that building permits in December surged 11% from the previous month to a seasonally adjusted $13.15 billion – a significantly stronger gain than the 1.4% increase economists had predicted, according to TD Securities.
The sharp rise reversed declines seen in October and November and was driven largely by a boom in residential construction permits, particularly in Ontario and British Columbia. On a constant dollar basis, which adjusts for inflation, total building permits were up 8.8% for December and 30.5% year-over-year, underscoring a strong end to 2024.
Building permits serve as an early indicator of future construction activity in Canada, based on data collected from 2,400 municipalities covering 95% of the population. However, the issuance of a permit does not guarantee that construction will begin immediately.
Despite the surge in permits, housing starts dropped 13% in December, falling to an annualized rate of 231,468 units, according to the Canada Mortgage and Housing Corporation (CMHC). Over the year, housing starts were up about 2%, driven by record-high rental construction levels and increased building activity in Alberta, Quebec, and the Atlantic provinces.
CMHC warned that Canada is unlikely to meet the national housing agency’s target for restoring affordability by 2030, even though housing starts are projected to stay above the 10-year average in 2025. The agency also suggested that construction activity may decline further in the coming years, citing a projected slowdown in condominium apartment construction through 2027.
The December increase in building permits was fuelled by a substantial rise in residential construction intentions, which soared to $8.97 billion. The biggest gains came from multifamily dwellings, with permits for these projects rising 33.3% in December, while single-family home permits edged up by 1.8%.
Meanwhile, non-residential building permits fell 5.9% to $4.18 billion, as a decline in commercial and institutional building plans outweighed a modest increase in industrial projects. The drop in non-residential permits was led by Quebec, while Ontario posted an increase in permit values.
Source CMP. Click here for the full story.

Allied’s Net Loss Decreases In 2024, Operating Income Rises
REIT reports year-end loss of $342.53 million, as it records $557.6M in writedowns on its assets

Real Estate Returns Remain Below Average: MSCI/REALPAC Index
Canadian Property Index returns 3.21 per cent in 2024: ‘We are a nice, stable performing country’

In The Ebb And Flow Of Toronto’s Office Sector, Financial Firms Anchor Down While Tech Tenants Set Sail
Comparing office utilization rates for specific North American cities shows that the occupier makeup of certain cities has had a material impact following COVID-19. Cities that rely heavily on tech and creative companies to fill offices, such as San Francisco, have lagged behind those that rely more heavily on financial firms, such as New York.
One of the advantages enjoyed by Toronto’s economy in recent years has been its relatively well-hedged economic diversity. Toronto is one of the top five cities in North America for both financial services and tech.
However, these services have tended to cluster within specific downtown submarkets. The clustering of financial and tech services firms within specific submarkets reveals a material divergence in general office performance metrics among the individual submarkets that comprise Toronto’s downtown core. Specifically, since the pandemic and the emergence of the work-from-home economy over the last few years, office availability rates have fluctuated based on location.

For example, the office availability rate in the Downtown West submarket, which houses many of Toronto’s tech firms, has steadily increased. In contrast, the Downtown South submarket has shown more resilience. This area of downtown Toronto, which is bisected by Bay Street, benefits from the steady demand for office space generated by financial services occupiers that congregate in this area.
It also benefits from Union Station and access points to the Gardiner Expressway, which offer comparatively faster commutes.
This disparity in office availability rates by submarket will likely hold in coming years, as overall office utilization remains lower today than before the pandemic. The rate at which it will recover is an open question that only time will tell.
One thing that is certain is that office utilization rates will not increase equally everywhere in an expected recovery. As demonstrated in the example of the two downtown submarkets, COVID’s impact on the office market is like glacial erosion. Its application is uneven, with some areas experiencing deposits of demand while others see it stripped away.
Source CoStar. Click here for the full story.
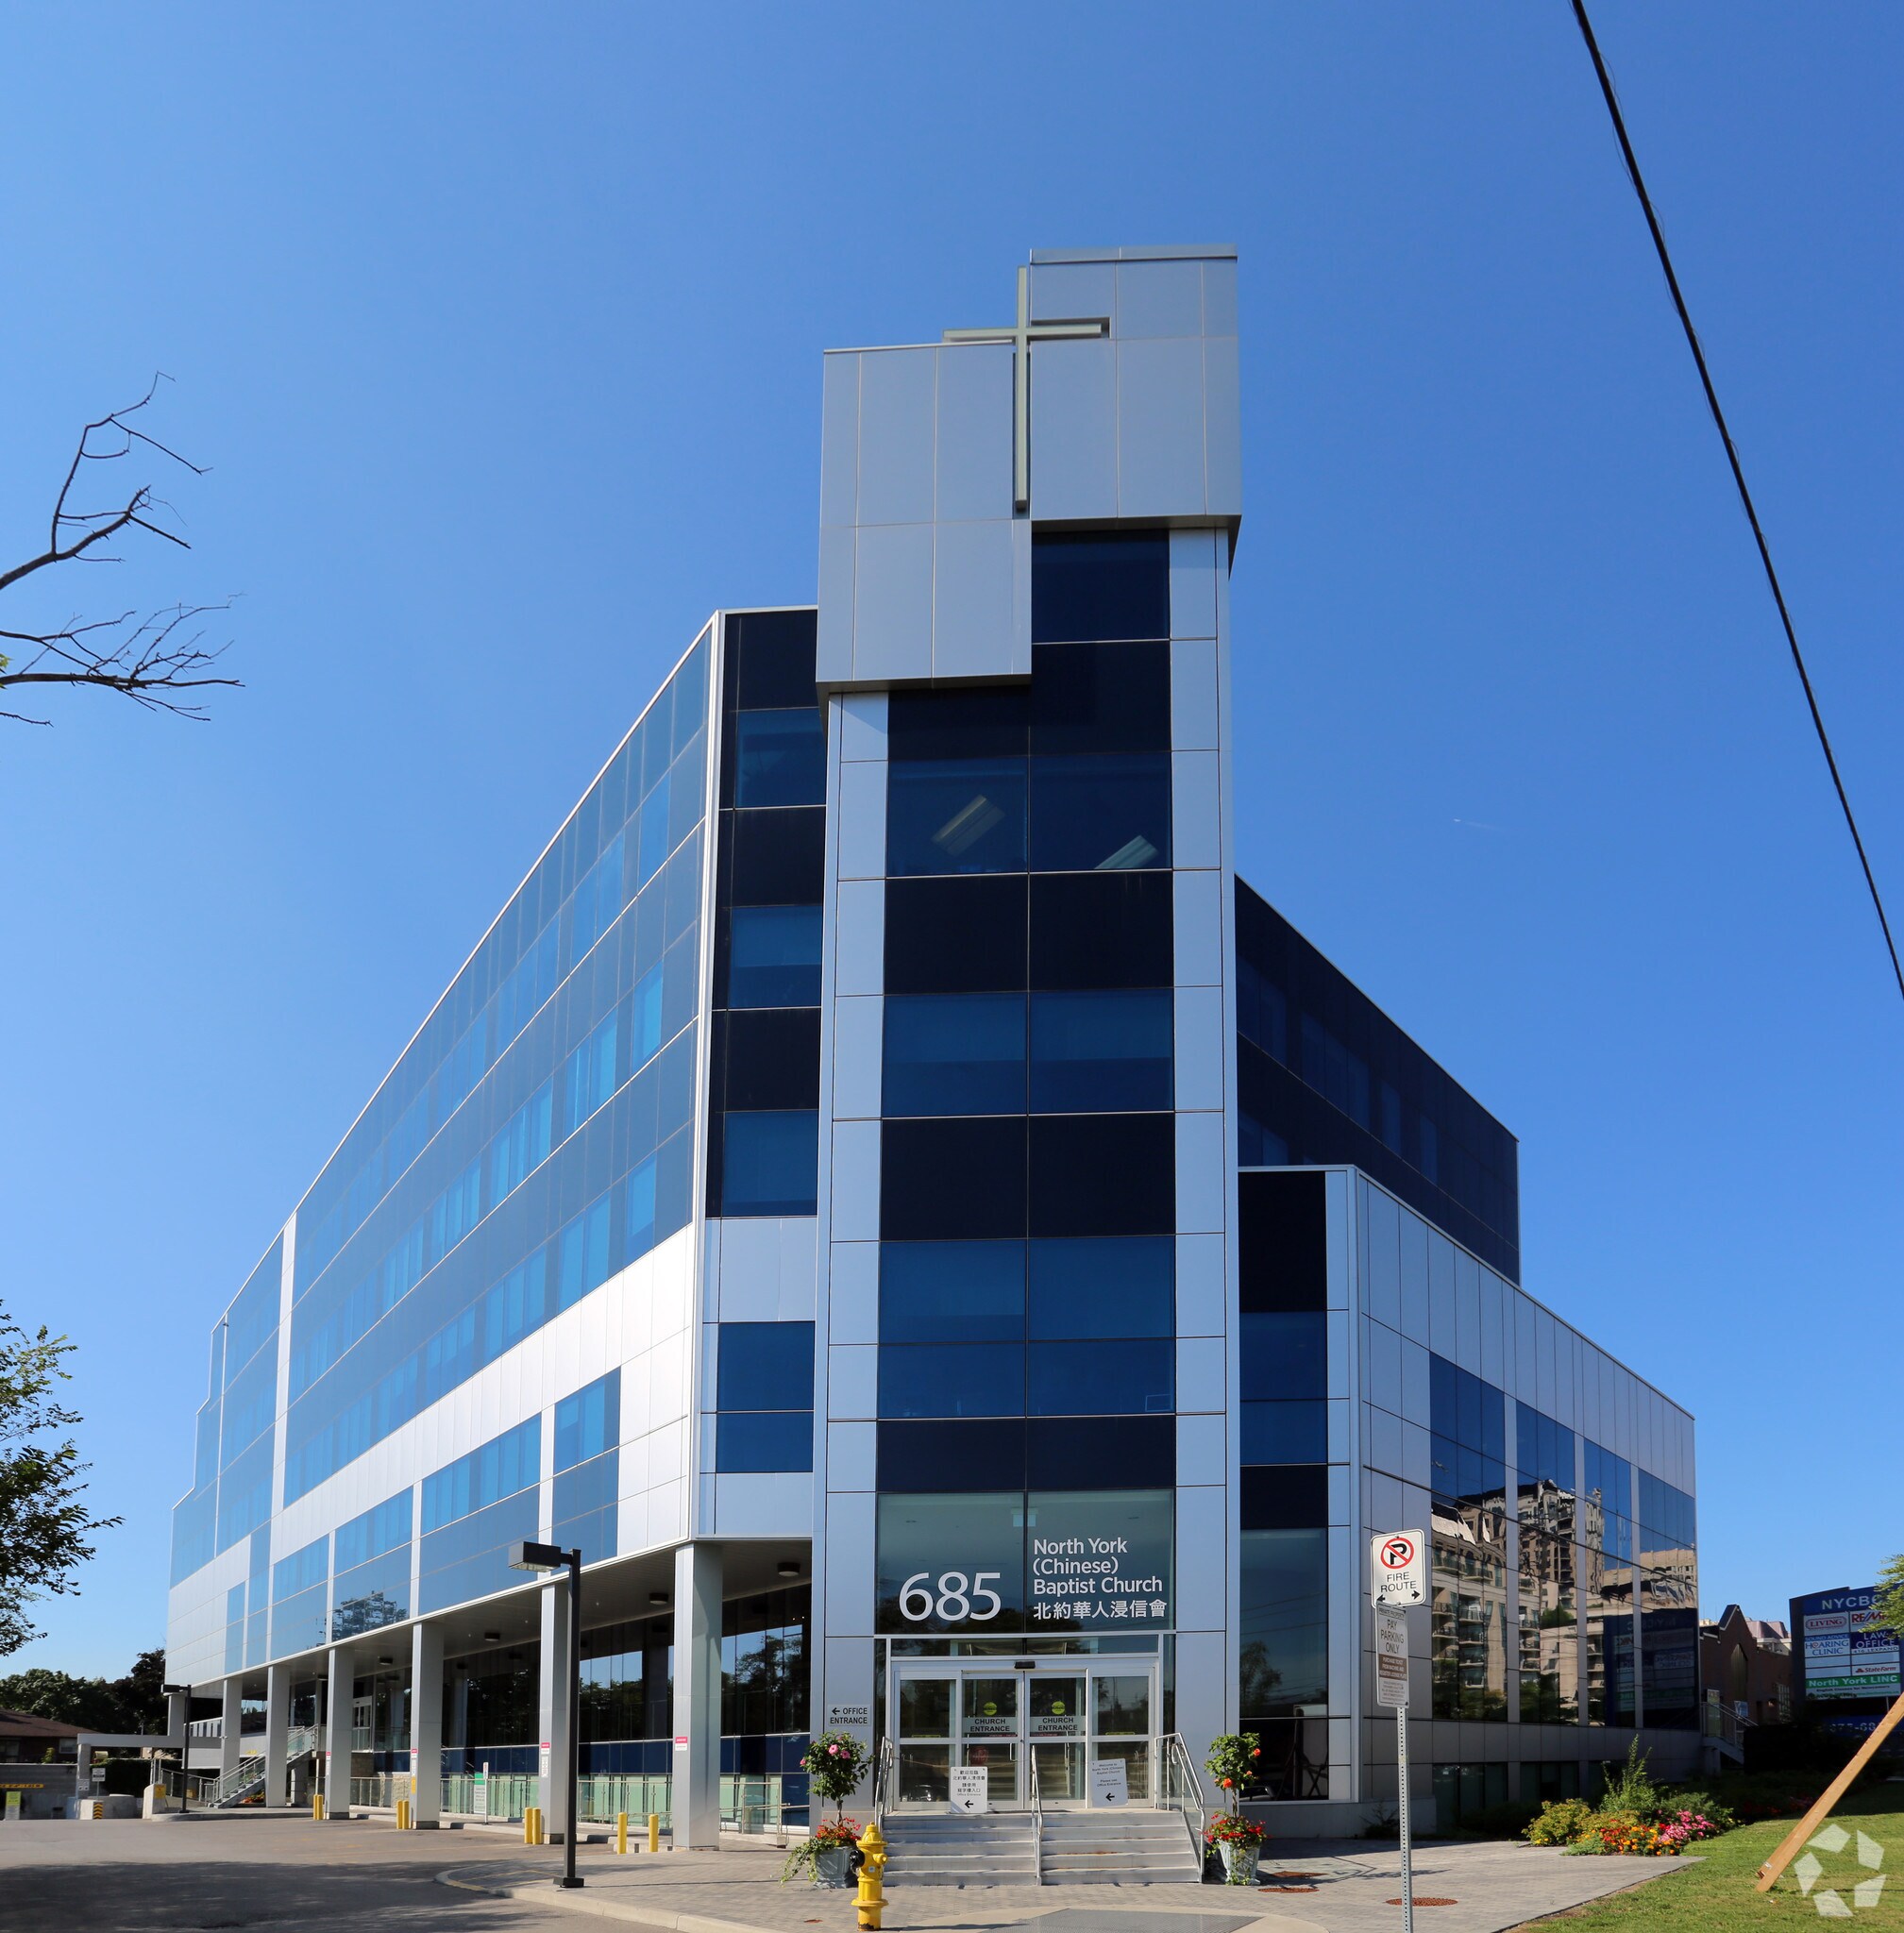
FOR LEASE – Daycare Space – Toronto
Address: 685 Sheppard Ave E, B01A, Toronto Available area: 7,417 Sq Ft Asking Price: $23.00 Sq Ft ...
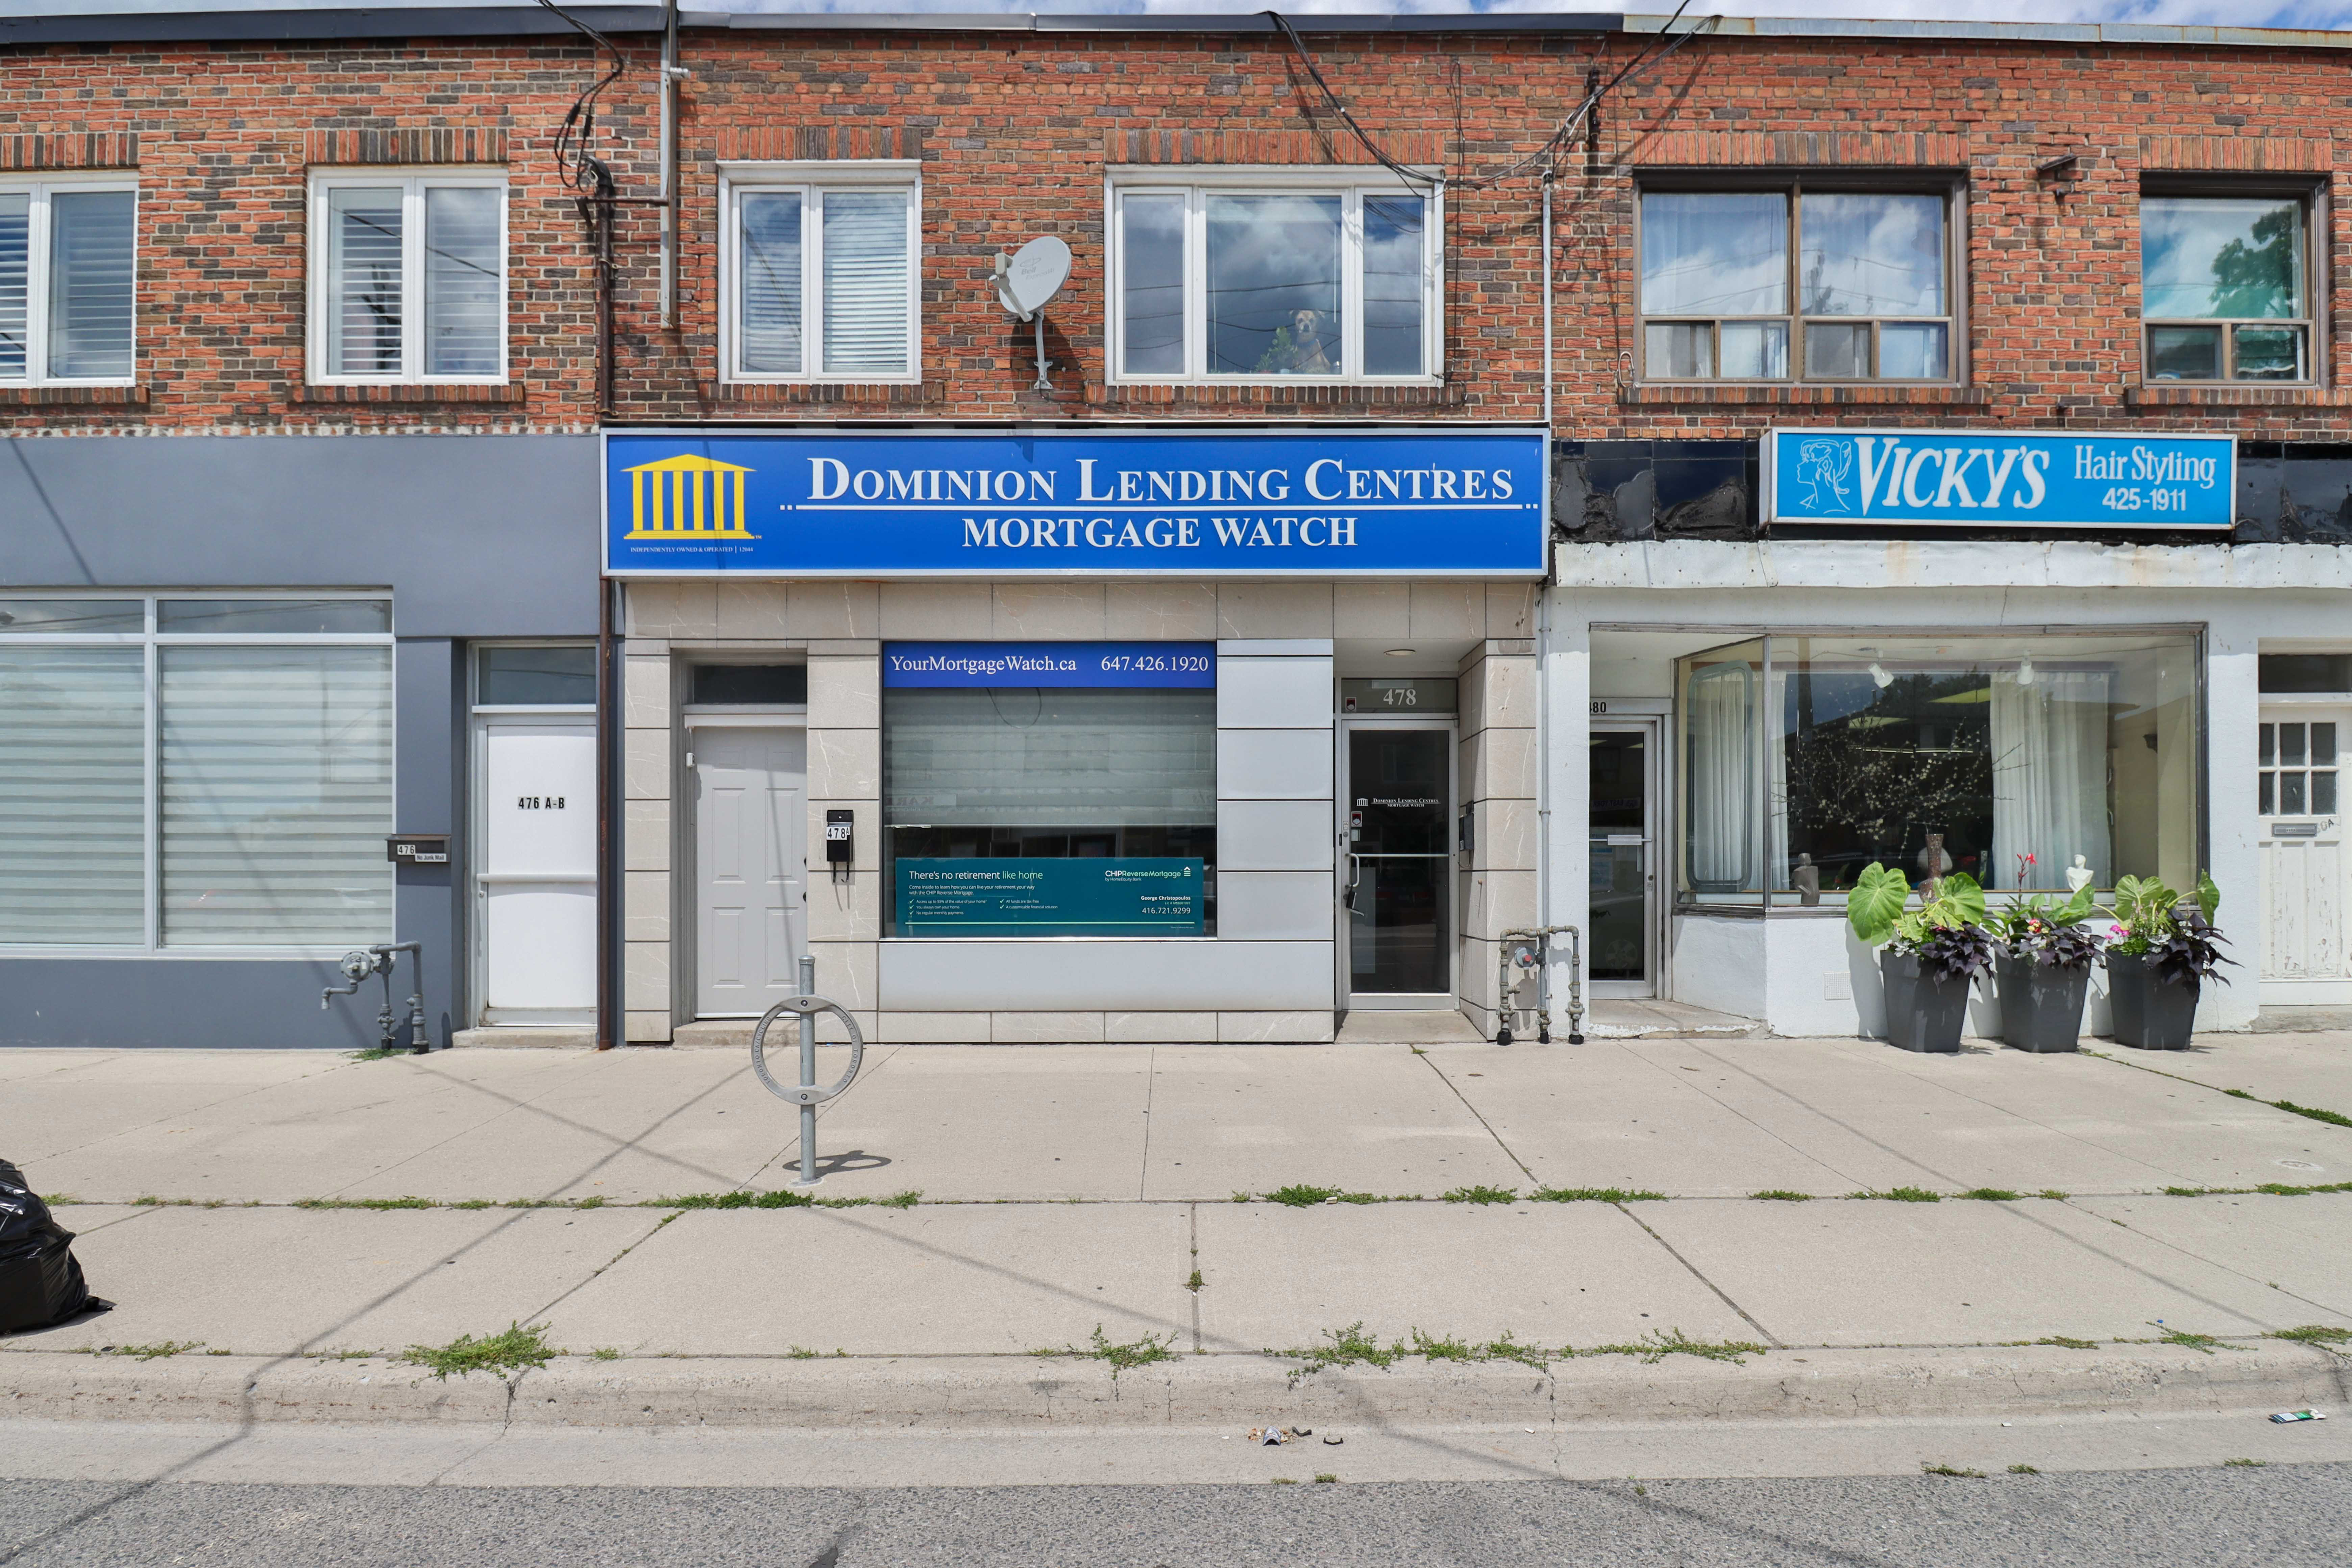
FOR LEASE – Office/Retail Space – Toronto
🏢 478 Cosburn Ave, Toronto, ON 💰 Asking Price: $3,500 Monthly 💲Taxes: � ...

FOR SALE – Retail Space – Toronto
Address: 270 Spadina Ave 3, Toronto Available area: 1,315 Sq Ft Price: $1,450,000 Rare opportunity t ...
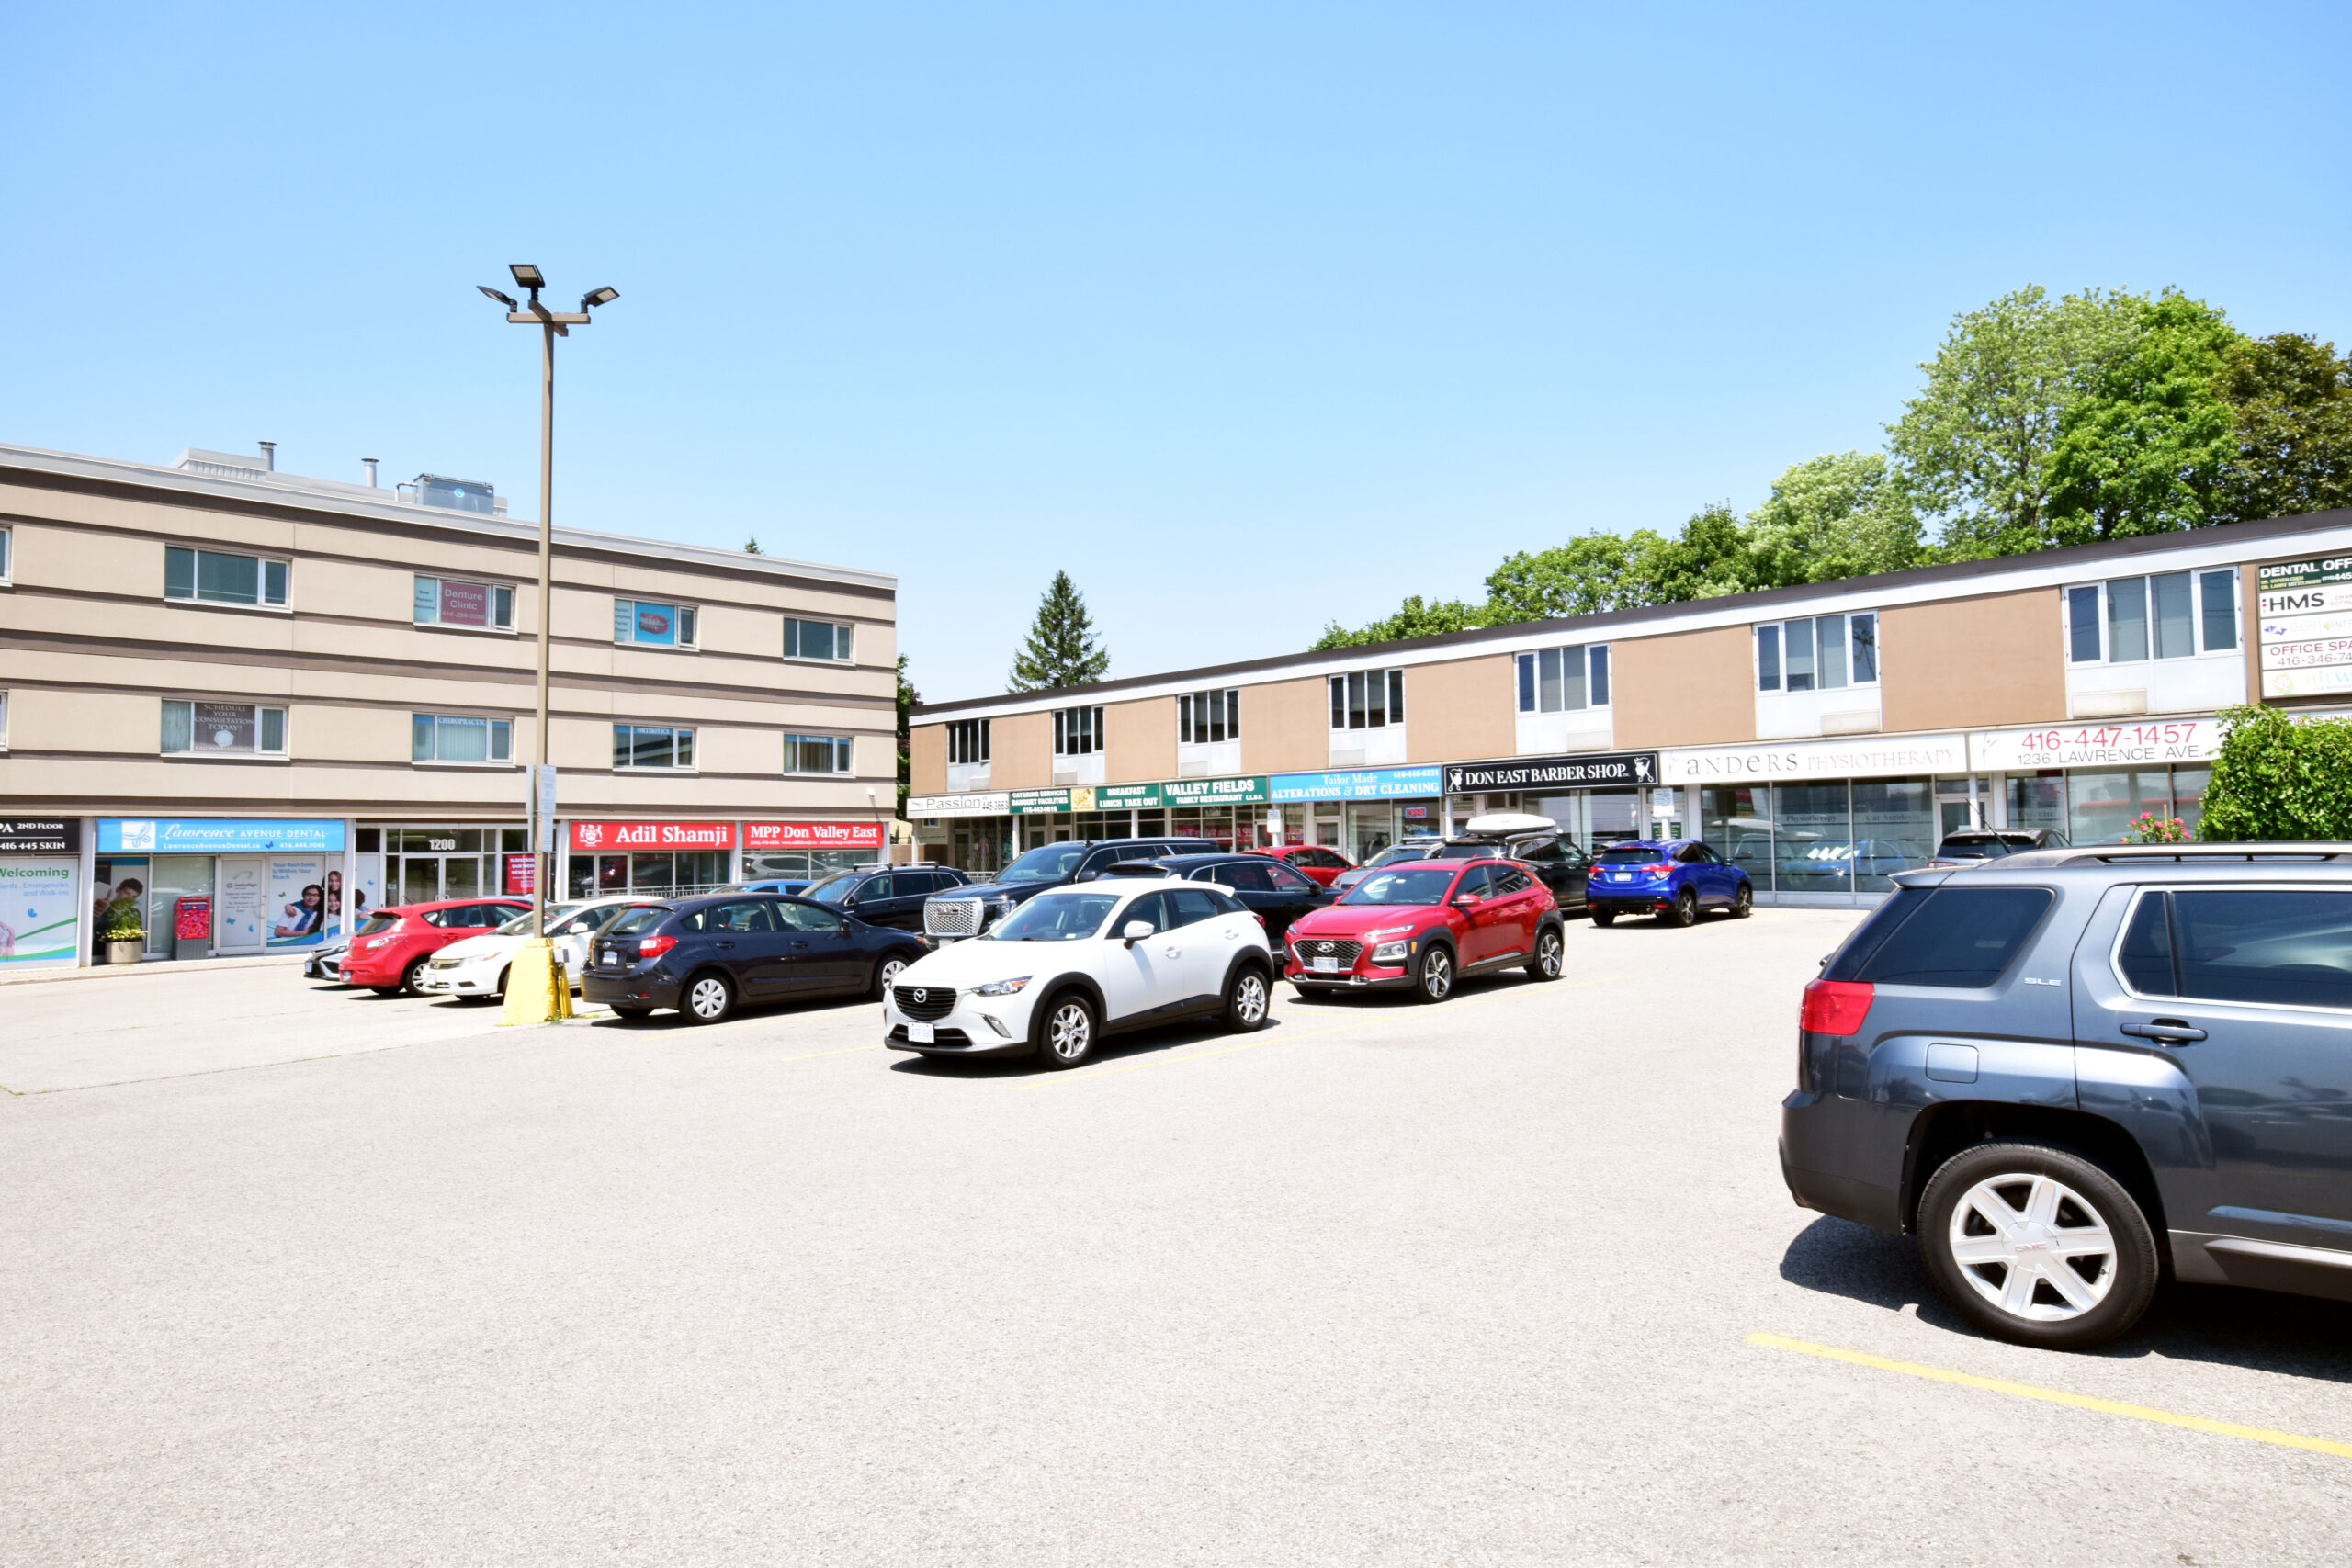
FOR LEASE – Office/Medical Space – Toronto
🏢 1200 Lawrence Ave E, Toronto Space: Use: Total Area: Asking Price: 300 Office/Medical 1 ...

FOR SALE – Café Business – Two Prime Locations – Toronto
Business Highlights (Combined for 2 locations): Asking Price: $250,000 Approx. NOI: $168,000 YoY gro ...

FOR LEASE – Retail/Office Space – Mississauga
CLICK HERE FOR THE BROCHURE Click Here For Zoning Map 🏢 4550 Hurontario Street Mississauga, ON � ...

FOR SUBLEASE – Office Space – Broadview Ave, Toronto
🏢 100 Broadview Avenue, 400, Toronto, ON 💰 Asking Price: $39.50 Gross Lease 📐 Total Ar ...

FOR LEASE – Office Space – Scarborough, ON
🏢 2190 Warden Ave, 212a, Toronto, ON 💰 Asking Price: $18 Sq Ft Net 💲Taxes: ...

FOR SALE – Commercial Building – Smith Falls, ON
🏢 28 Beckwith St N, Smith Falls, ON 💰 Asking Price: $499,000 💲Taxes: ...

FOR SALE – Industrial And/Or Office Building – Etobicoke, ON
🏢 41 Chauncey Ave, Toronto (Etobicoke) 💰 Asking Price: $4,000,000 📐 Building S ...
![]()
Toronto Commercial Properties
Stephen & Mariya Lilly
Commercial Brokers
Office: 416-494-7653
Mariya Cell: 416-824-5078
Stephen Cell: 416-802-4228