Key highlights
-
Altus Group’s second annual Global Construction Costs webinar is now available to watch
-
Developers are getting a bit of a reprieve from the painful escalation in construction costs seen in recent years; however, that relief is not evident everywhere
-
During the webinar, experts from Altus Group’s development advisory team discuss how micro-economic factors, as well as inflation, interest rates and trends around AI and sustainable development practices are influencing the outlook for cost escalation within different regions
Altus Group’s second annual Global Construction Costs webinar delves into factors influencing regional cost escalation
Developers are getting a bit of a reprieve from the painful escalation in construction costs seen in recent years. Stabilizing construction costs across many geographies was one of the common themes discussed in Altus Group’s recent Global Construction Costs webinar.
However, that relief is not evident everywhere, and the rate of cost increases varies widely depending on the local market, property sector, and scale of a project. In addition, the break from soaring costs may be short-lived with significant cost pressures still at play. Experts from Altus Group’s Development Advisory team discuss how micro-economic factors, as well as inflation, interest rates, and trends around AI and sustainable development practices are influencing the outlook for cost escalation within different regions.
“Labor shortages are an issue across the board, and that is going to become more of a challenge as we go into manufacturing and other types of complicated projects,” says Faris Rehman, Director in our Development Advisory team in Houston. Although construction pipelines for some sectors are slowing, increased federal government spending on infrastructure is expected to put more demand on materials and potentially transfer labor from residential projects to those more specialized projects, he adds.
Global trends to watch
-
The combined effect of cost escalation and stagnating revenues is expected to result in more distressed developments and assets coming to the market.
-
AI has promise in some areas of the construction industry, particularly in areas where there is an ability to leverage the power of its predictive forecasting. Potentially, AI could be useful in project planning and feasibility analysis.
-
Regulations, development fees, delays, and taxes are putting more cost pressure on developers, which has a direct impact on the feasibility of projects.
-
On-going conflicts in the Middle East and Europe remain a major risk factor and potential wild card for the development industry, along with the upcoming US presidential election
-
Sustainable building practices remain a key topic of conversation in the building industry, with more attention focusing on how to reduce embodied carbon in buildings and building materials.
United States
Construction costs in the US have increased between 25% and 40% since 2020, and it’s unlikely that costs will return to pre-pandemic levels. High inflation appears to be under control, and cost escalation has pulled back to more historical levels of 3.5% to 4%.
“We’ve seen stabilization in the supply chain, which is a big positive improvement. However, we still do have issues across for other sub-trades, in particular electrical and mechanical wherein the lag time still hasn’t improved, and that is going to be the trend going forward as well,” says Rehman. Interest rates have dampened the demand side of projects in the pipeline. Developers also are experiencing higher capital costs and tighter liquidity due to regional banks in the US that are under stress.
Outlook: Construction costs overall are more stable, but still rising. Cost increases have dropped back to historic levels in the range of 2 to 6% annually. However, increases will vary depending on the region with lesser escalation in the Midwest, like Chicago and higher levels in hot spots such as Phoenix. Project type also will influence cost increases related to both materials and labor, with higher escalation expected in the heavy industrial and manufacturing sector and gradual return to traditional ranges in the multifamily segment
Canada
Canada’s high population growth is straining its housing capacity and driving up costs. Last year, Canada’s population grew by over 3%, which makes it one of the fastest-growing countries in the world. The Canadian Mortgage and Housing Corporation (CMHC) estimates that the country needs more than 5 million new homes by 2030, which would require tripling its current building rate. “Our housing starts are falling rather than going up, so the problem is severe and getting much worse,” says David Schoonjans, Senior Director in our Development Advisory team in Toronto.
Developers have the desire and expertise to build but are dealing with a glacial pace of approvals and changing regulatory environment around green standards and carbon pricing. Easing some of the bureaucratic hurdles that exist will take considerable time. Studies that Altus has done show that development approval durations have extended in recent years, across most markets. In its 2020 Doing Business report, the World Bank also ranked Canada as the second worst in the OECD for the time component of its “Dealing with construction permits” attribute. “So, we have a lot of work to do and it’s not going to change overnight,” says Schoonjans.
When Altus Group launched its 2024 Canadian Cost Guide in January 2024, it indicated that inflationary pressures, and construction costs have stabilized in Canada. Although that remains generally true, there are some nuances in construction trends. For example, interest rate increases have created bigger challenges to housing construction in Toronto, which was already a very high-cost market. High housing prices have shifted migration and construction activity to more affordable cities such as Calgary.
Mixed outlook: Toronto and Calgary bookend the two extremes in Canada. Looking specifically at high-rise residential, costs in Toronto have been coming down slightly. By the end of 2024, costs may decrease by 2 to 3% from what remains a very high basis. “We do believe that is going to be short-lived because of the pressure from housing shortages,” says Schoonjans. “It’s entirely possible that we’ll see 10% cost escalation by 2026.” Calgary is likely to experience cost increases this year due to the in-migration of people moving to the city.
Europe and Australia
Across Europe, prices appear to be stabilizing on materials, while labour issues are continuing to rise. Western states tend to have higher demand and lower labor availability, which is driving bigger increases. Those states that are struggling with high unemployment and low growth, such as Spain and Greece, are experiencing lower levels of cost increases.
In Australia, construction costs are still ticking higher, due primarily to labor costs. According to Altus Group’s latest Australian Construction Materials Price Outlook, Australia’s residential construction is failing to keep up with population growth. It is estimated that an additional 450,000 workers are needed to build houses to meet demand in Australia. “The driver is around migration, which is a bit of a double-edged sword,” says Niall McSweeney, President of the Development Advisory team in Sydney. There is a need to bring more people in to fill jobs, while more people also fuels greater demand for affordable housing, he adds.
Outlook: Overheated markets, such as southeast Queensland, and poor participation by delivery partners in the residential sector in New South Wales are causing extremely high levels of price increases. In addition, natural disasters, including flooding from cyclones, is having an impact on markets in the far north of Australia. Flooding will spur more rebuilding activity in areas such as New South Wales, which will further impact availability of materials and labor. Generally, construction costs are likely to rise between 4 and 8%, with some areas and sectors that rise far beyond that 8%.
Conclusion
Globally, a common theme is that the rate of cost escalation is very nuanced due to local and regional factors. As such, it is prudent to talk with a cost consultant about specific locations and projects and not rely on general rate information and forecasts when analyzing construction costs and project feasibility.
Source Altus Group. Click here to read a full story.

Key highlights
-
Property tax is the largest, single expense for most property owners, representing nearly 25% of net operating income (NOI) on average, and is often overlooked as an important “lever” that can be pulled to impact commercial real estate valuations
-
Property owners who are not proactively managing their real estate taxes, particularly in the current market climate, may be contributing to a decline in their property values
-
When real estate assessors value a property, they use mass appraisal techniques whereas property tax experts dig deeper to get to the real value; that includes doing research, analyzing data, and conducting comparisons with similar properties
-
Managing your property tax liability must begin when the notice of assessed value is received. When the tax bill arrives, it is too late
Property tax as a valuation lever
The value of a commercial real estate property is one of the most important metrics — if not the most important — that any manager, finance team, or owner must continually track. A higher property value can mean increased occupancy, higher rental income, and a more attractive selling price if the building is sold.
While valuations are often dictated by market forces outside a property owner’s control, there are several “levers” an owner can pull to impact valuation. Things like building maintenance costs, ESG upgrades, insurance and tenant-friendly amenities are all examples of areas where smart management can impact CRE values. Property tax is one of the most significant costs that CRE firms face, however it is oftentimes overlooked as one that can be managed.
Your property tax management strategy can have a big impact
Property taxes make up a substantial portion of a commercial building’s operating expenses, and therefore, have a major impact on its profitability.
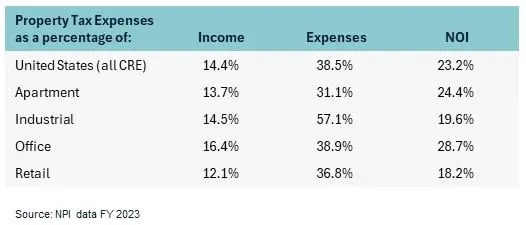
In fact, property tax is the largest, single expense for most property owners. According to the NCREIF property index, in 2023 property tax represented nearly 25% of net operating income (NOI) on average across all commercial real estate sectors in the US.
Figure 1: NCREIF Property Index FY2023 – The significance of property tax expenses
If an owner or investor can proactively reduce their tax bills, they can make a big impact on NOI, and potentially on the value of their property.
A simple calculation illustrates how reducing property tax impacts NOI. For example, assume an office building is valued at $5 million, using a 5% cap rate. If property taxes on that building are $100,000 per year, a 10% reduction in property taxes can lead to a 4% increase in NOI in a gross lease environment. In a net lease environment, the property tax reduction lowers tenants’ gross occupancy costs. This can assist with tenant retention or provide room to increase base rents. In each case, there is a substantial positive impact on the value of the property.
However, if a building owner or investor does not actively manage property tax expenses, the increasing costs will negatively impact NOI and/or gross occupancy costs. There will be less capital available to improve the property, tenants will be less motivated to stay, and higher gross occupancy costs will mean you can charge less rent. All of these will have a negative impact on the building’s valuation.
Source Altus Group. Click here to read a full story.

Key highlights
-
In the first quarter of 2024, the national office availability rate across Canada stabilized at 17.5%
-
The hybrid work model has cemented itself as a preferred work arrangement, as the share of workers with hybrid arrangements has more than tripled since the start of the pandemic
-
The Quebec market reported the lowest office availability rate at 11.9%, followed by Vancouver and Ottawa, respectively
-
The Calgary market continued to record the highest availability at 23.2%
-
As of the first quarter of 2024, 5 office buildings were completed, with Toronto leading the country in the total completed office buildings
-
Nationally, 50 office projects were under construction in Q1 2024, totalling 8.1 million square feet, with 52% pre-leased
Office availability rates remained flat across Canada
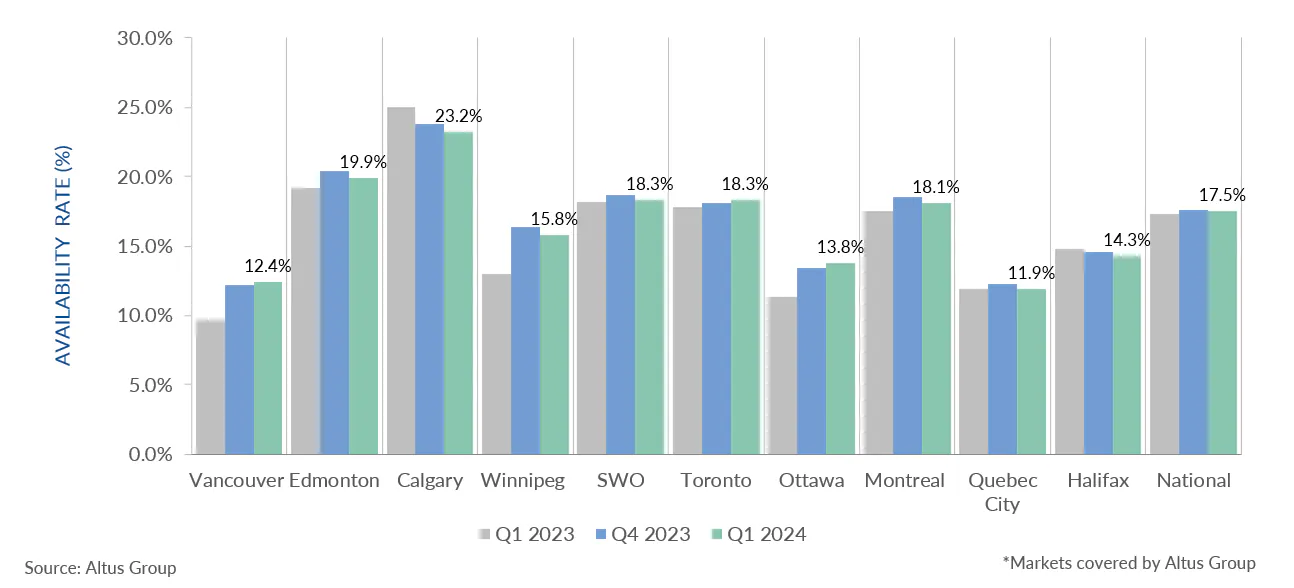
In the first quarter of 2024, the national office availability rate across Canada stabilized at 17.5% for the fourth consecutive quarter (Figure 1), as sublet space steadily decreased. Furthermore, according to Statistics Canada, the hybrid work model has cemented itself as a preferred work arrangement, as the share of workers with hybrid arrangements has more than tripled since the start of the pandemic.
Office leasing transactions continued to be predominately skewed toward Class-A buildings compared to Class-B and C buildings as businesses prioritized high-quality, amenitized spaces located in centralized areas. This phenomenon, which has been dubbed the “flight to quality”, has been a component in the discussion of adaptive reuse, specifically office-to-residential conversion.
According to Statistics Canada’s Labour Force Survey (LFS), as of March 2024, employment remained virtually unchanged (-2,200, -0.0%), as population growth continued to outpace employment growth. In addition, the unemployment rate increased slightly by 0.3 percentage points to 6.1%, due to softening in the accommodation, food services and retail trade. Gains in employment were noted primarily in health care and social assistance. Meanwhile, losses in employment were led by accommodation and food services.
Figure 1 – Office availability (Q1 2023 vs. Q4 2023 vs. Q1 2024)
The Quebec market reported the lowest office availability rate at 11.9%, followed by Vancouver and Ottawa, respectively (Figure 1). The Calgary market continued to record the highest availability at 23.2%; however, at the same time, Calgary has continued to observe declines in its availability rate. This downward trend is primarily due to the city’s Downtown Calgary Development Incentive Program, which has assisted in gradually removing underutilized and vacant spaces from the market’s inventory and increasing leasing activity. Other major markets across Canada have begun to explore the creation of incentive programs to subsidize private office conversions, but current economic conditions have presented numerous challenges to its design.
Figure 2: Office completions and availability (Q1 2024)
As of the first quarter of 2024, 5 office buildings were completed. Toronto leads the country in the total completed office buildings, with 2 office buildings totalling 1.4 million square feet, including the completion of the Cadillac Fairview’s office tower in downtown Toronto (Figure 2).
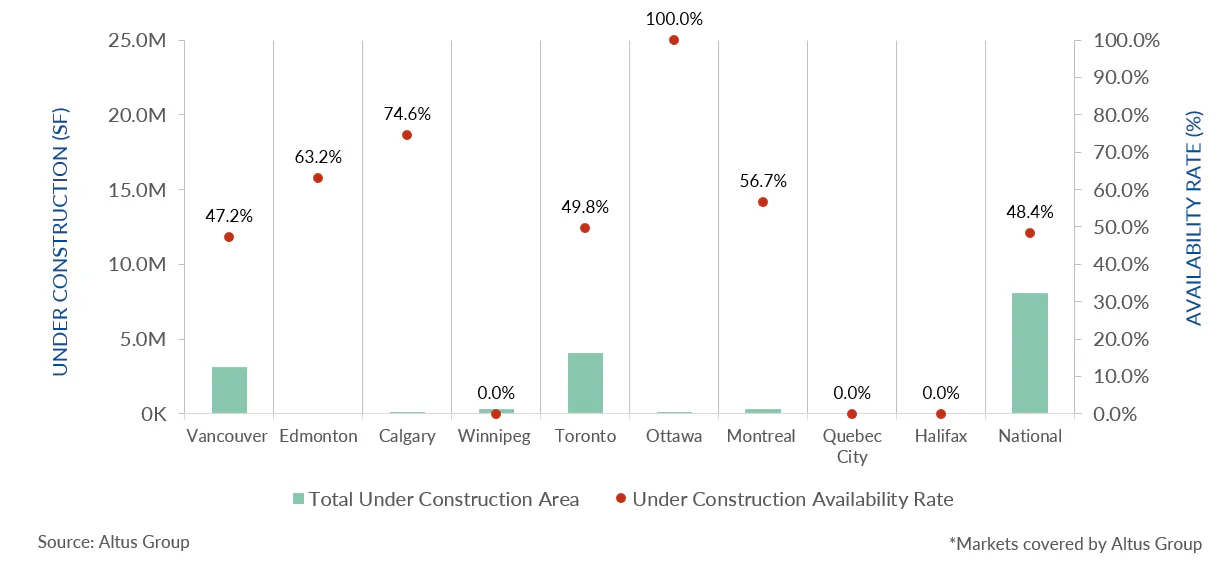
Figure 3: Office under construction and availability (Q1 2024)
With office vacancies continuing on an upward trend, the demand for office space has diminished and no new significant large office towers have been announced. Nationally, 50 office projects were under construction in the first quarter of 2024, totalling 8.1 million square feet, with 52% pre-leased (Figure 3). Vancouver and Toronto led the country with the highest number of office projects under construction, 23 and 17 projects, totalling 3.1 and 4.1 million square feet, respectively.
Conclusion
As the hybrid work arrangement has observed an upward momentum since 2022, landlords and businesses have responded with the optimization of office space and human resources to reduce expenses. Furthermore, the economic slowdown and rising uncertainty have led to investors and developers adopting a pens-down approach to new office project developments. Demand for office space in Canada is expected to remain strong for newer and well-located office buildings in 2024, while landlords work to secure new and existing tenants.

Key highlights
Altus Group releases its third installment of the Commercial Real Estate Industry Conditions and Sentiment Survey for Canada, a quarterly survey of CRE professionals to gauge perspectives on current and future conditions for the industry.
-
Targeted gross IRRs seen marketed for new funds and deals declined modestly across all four main property types (industrial, multifamily, retail, office) compared to the prior quarter
-
Canadian survey respondents expect debt funds and banks to have the greatest amount of capital availability over the next year
-
Cost of capital, development costs, and inflation remain top priorities for the next 12 months, while concerns about operating costs and tenant retention have also increased
-
The majority of Canadian respondents (63.2%) believe ESG needs “investor or market demand” for it to be more widely considered and incorporated by the CRE industry
Perspectives amongst Canadian commercial real estate participants indicate some quarter-over-quarter shifts
Altus Group conducted a survey across Canada to provide insights into the market sentiment, conditions, metrics, and issues affecting the commercial real estate (CRE) industry. We are happy to announce that the Q1 2024 results for Canada are now available for download.
The survey captured the individual practitioner’s perspective, representing various functions across the capital stack.
The Q1 installment of the Canada survey was conducted between January 23rd and February 9, 2024. There were 214 respondents, representing at least 55 different firms.
Questions in the survey focused on two main topics: current conditions and future expectations. Percentages used throughout the Canada survey results are representative of the share of all Canada responses received for each question, excluding “blank” or “not applicable” responses.
Key takeaways from the Q1 2024 survey
Target returns for new funds come down modestly
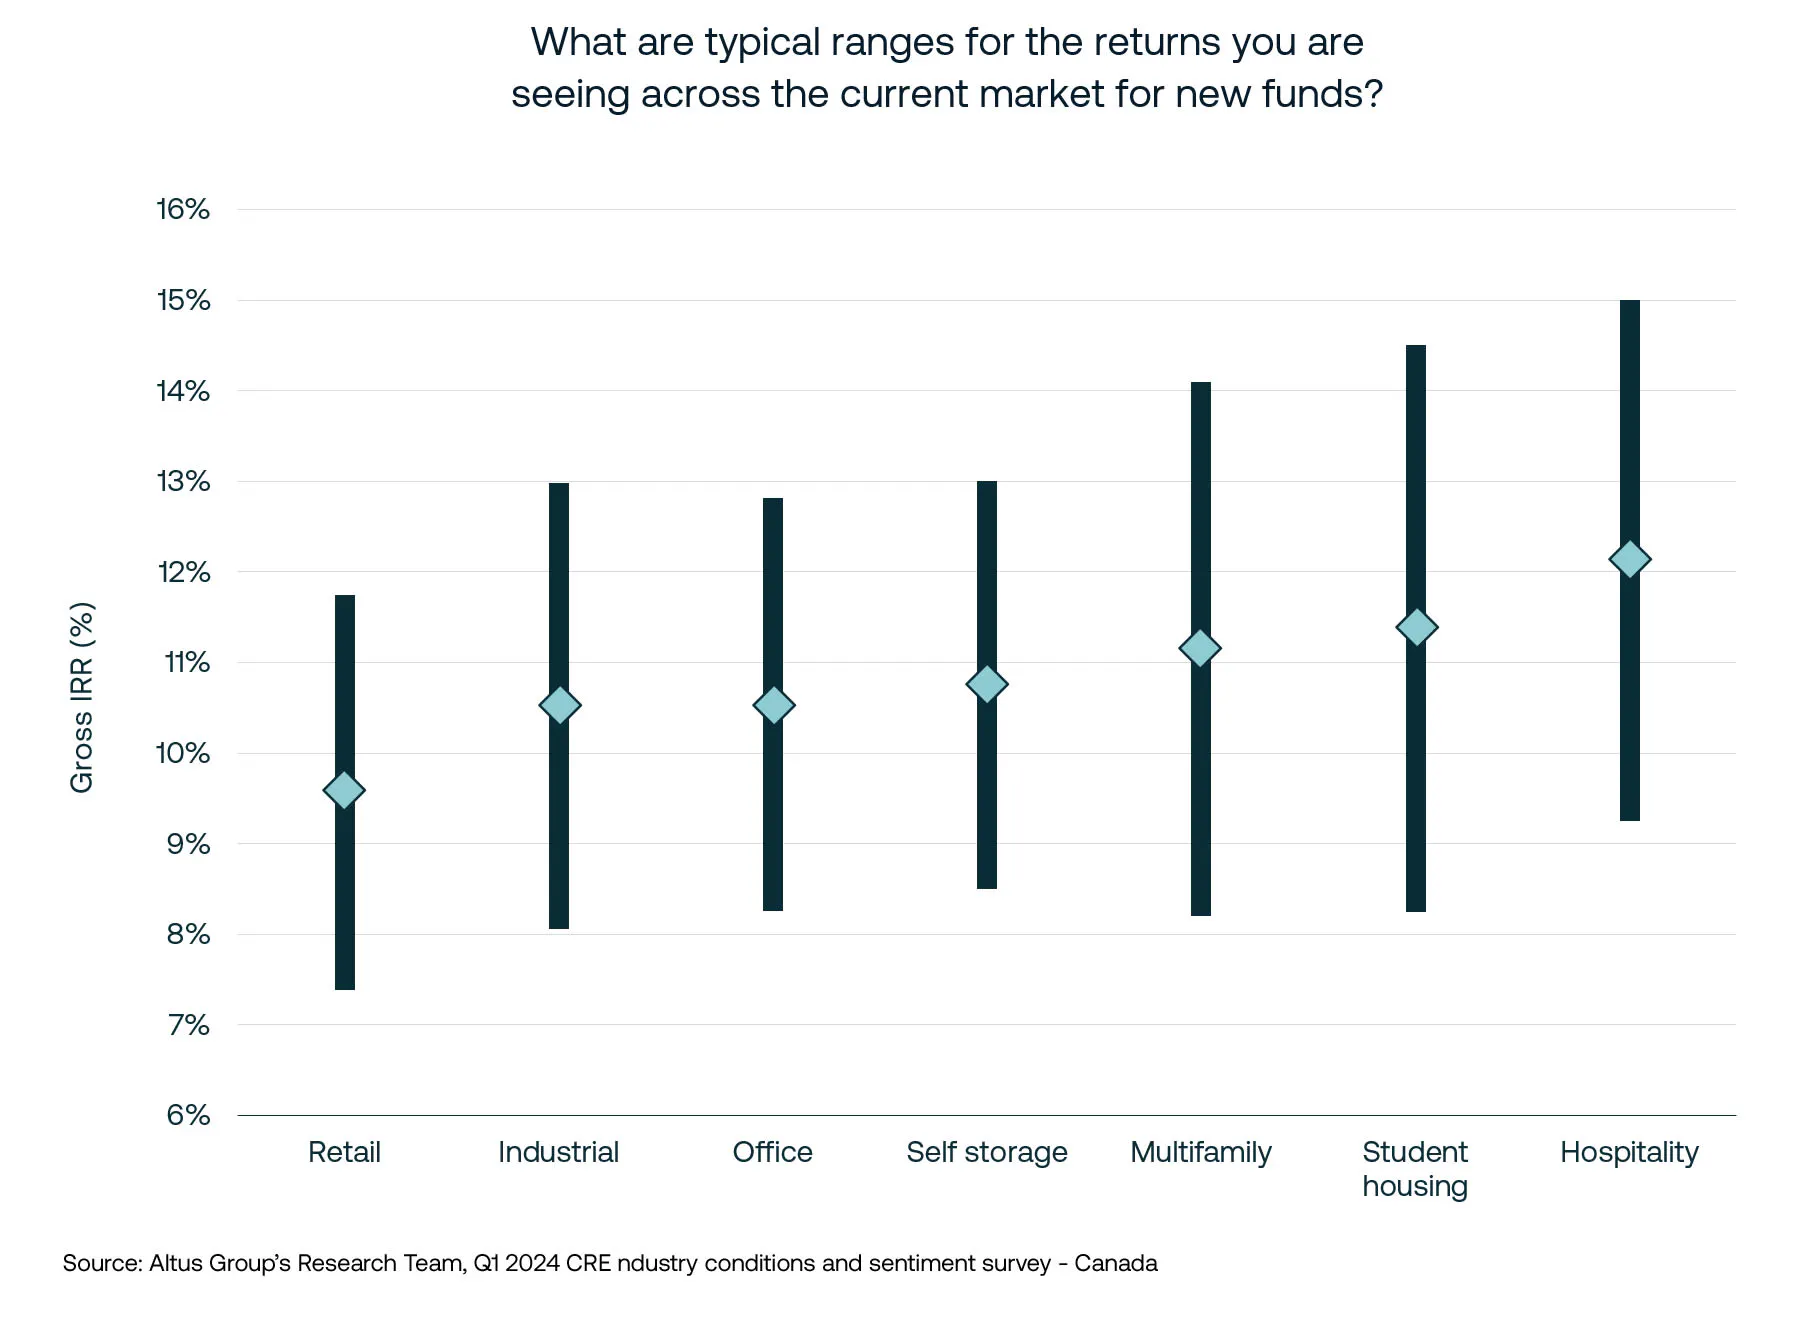
Targeted gross IRRs marketed for new funds and deals averaged at 10.8% for all property types in Q1 2024. This is a decrease of 78 bps from the previous quarter. The reported average gross IRR for the four main property types – retail, multifamily, office, and industrial – was 10.4%, down 9 bps from Q4 2023.
However, the hospitality sector saw the largest increase in reported midpoint IRRs, moving up by 288 bps to 12.1% in Q1 2024. Conversely, self-storage reported the largest quarterly decline in midpoint IRRs, with a drop of 250 bps to 10.7% .
Figure 1 – Canada survey results: What are typical ranges for the returns you are seeing across the current market for new funds?
Net expectations for capital availability up for all sources except banks
While the overall expectation is that capital availability is expected to remain low over the next 12 months, the net expectations have improved since Q4 2023. This improvement is based on the sum of responses for “extremely available” and “very available” less the sum of responses for “not very available” and “not at all available”.
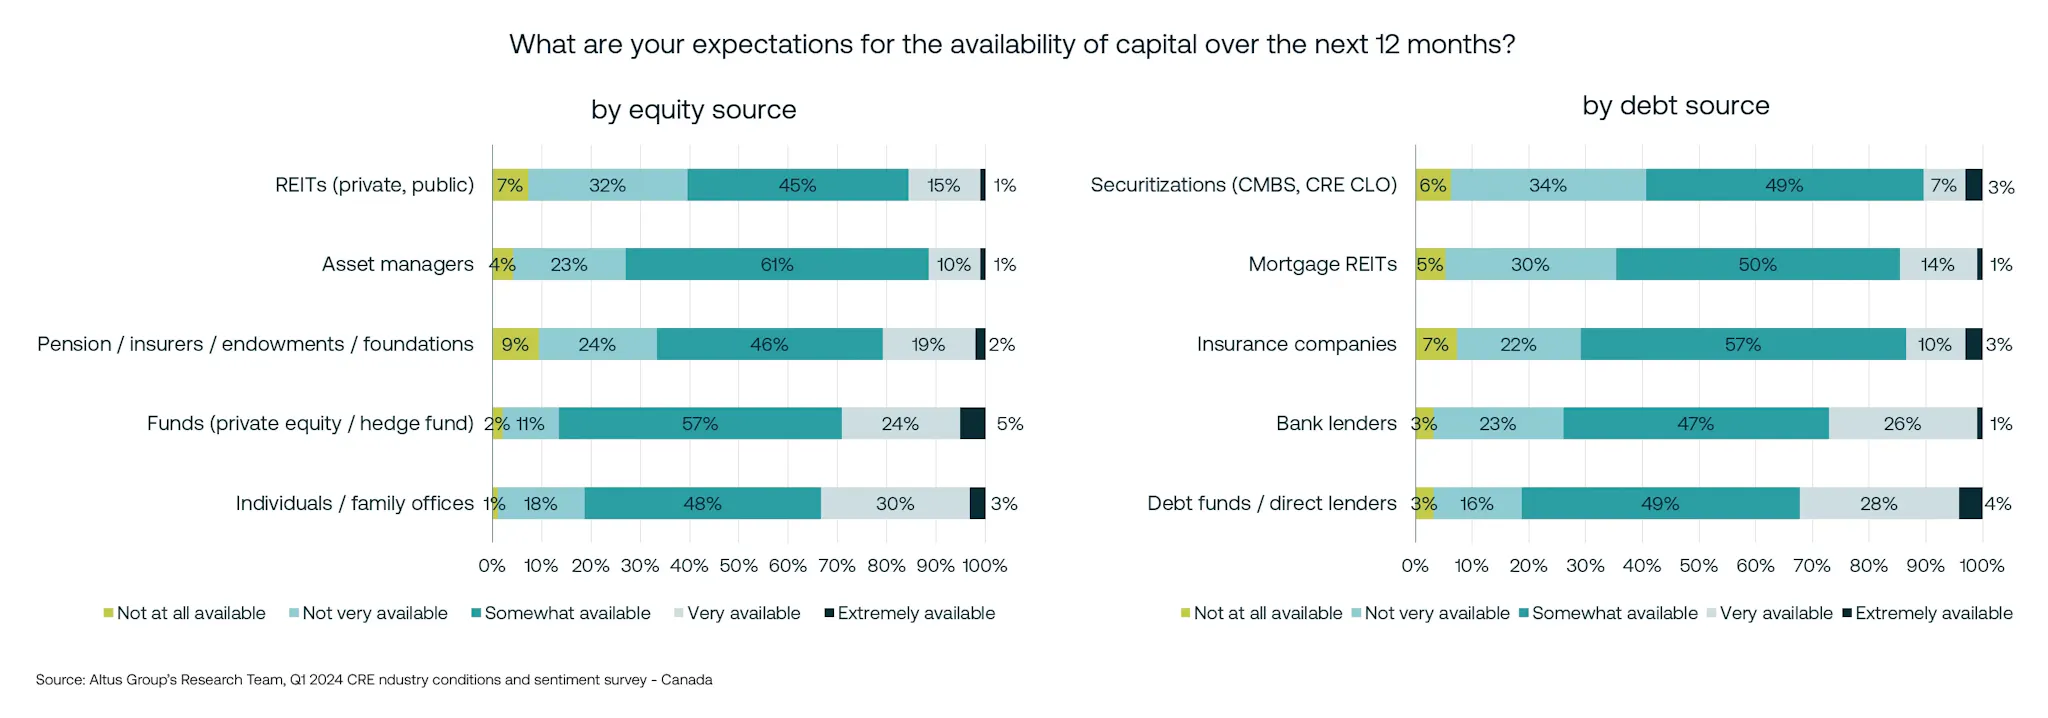
For sources of equity capital, survey participants indicated that they collectively expect the least amount of capital availability from REITs and asset managers – with net expectations of -24% and -16% respectively, a notable improvement from -39% and -24% in Q4 2023. Meanwhile, participants expect greater availability of equity capital from individuals / family offices and PE / hedge funds. The survey also revealed that securitizations, mortgage REITs, and insurers are expected to be heavily constrained, with net expectations of -30%, -21%, and -16% respectively.
Canadian CRE professionals expect debt funds and banks to have the greatest amount of capital availability over the next year, with 32% and 27% of respondents expect that capital will be “extremely” or “very” available, respectively. This is similar to the previous quarter’s results. It’s worth noting that Canadian bank capital availability expectations are quite different from those in the US (see the US results for more detail).
Figure 2 – Canada survey results: What are your expectations for the availability of capital over the next 12 months?
Capital concerns ease, cost concerns still top of mind
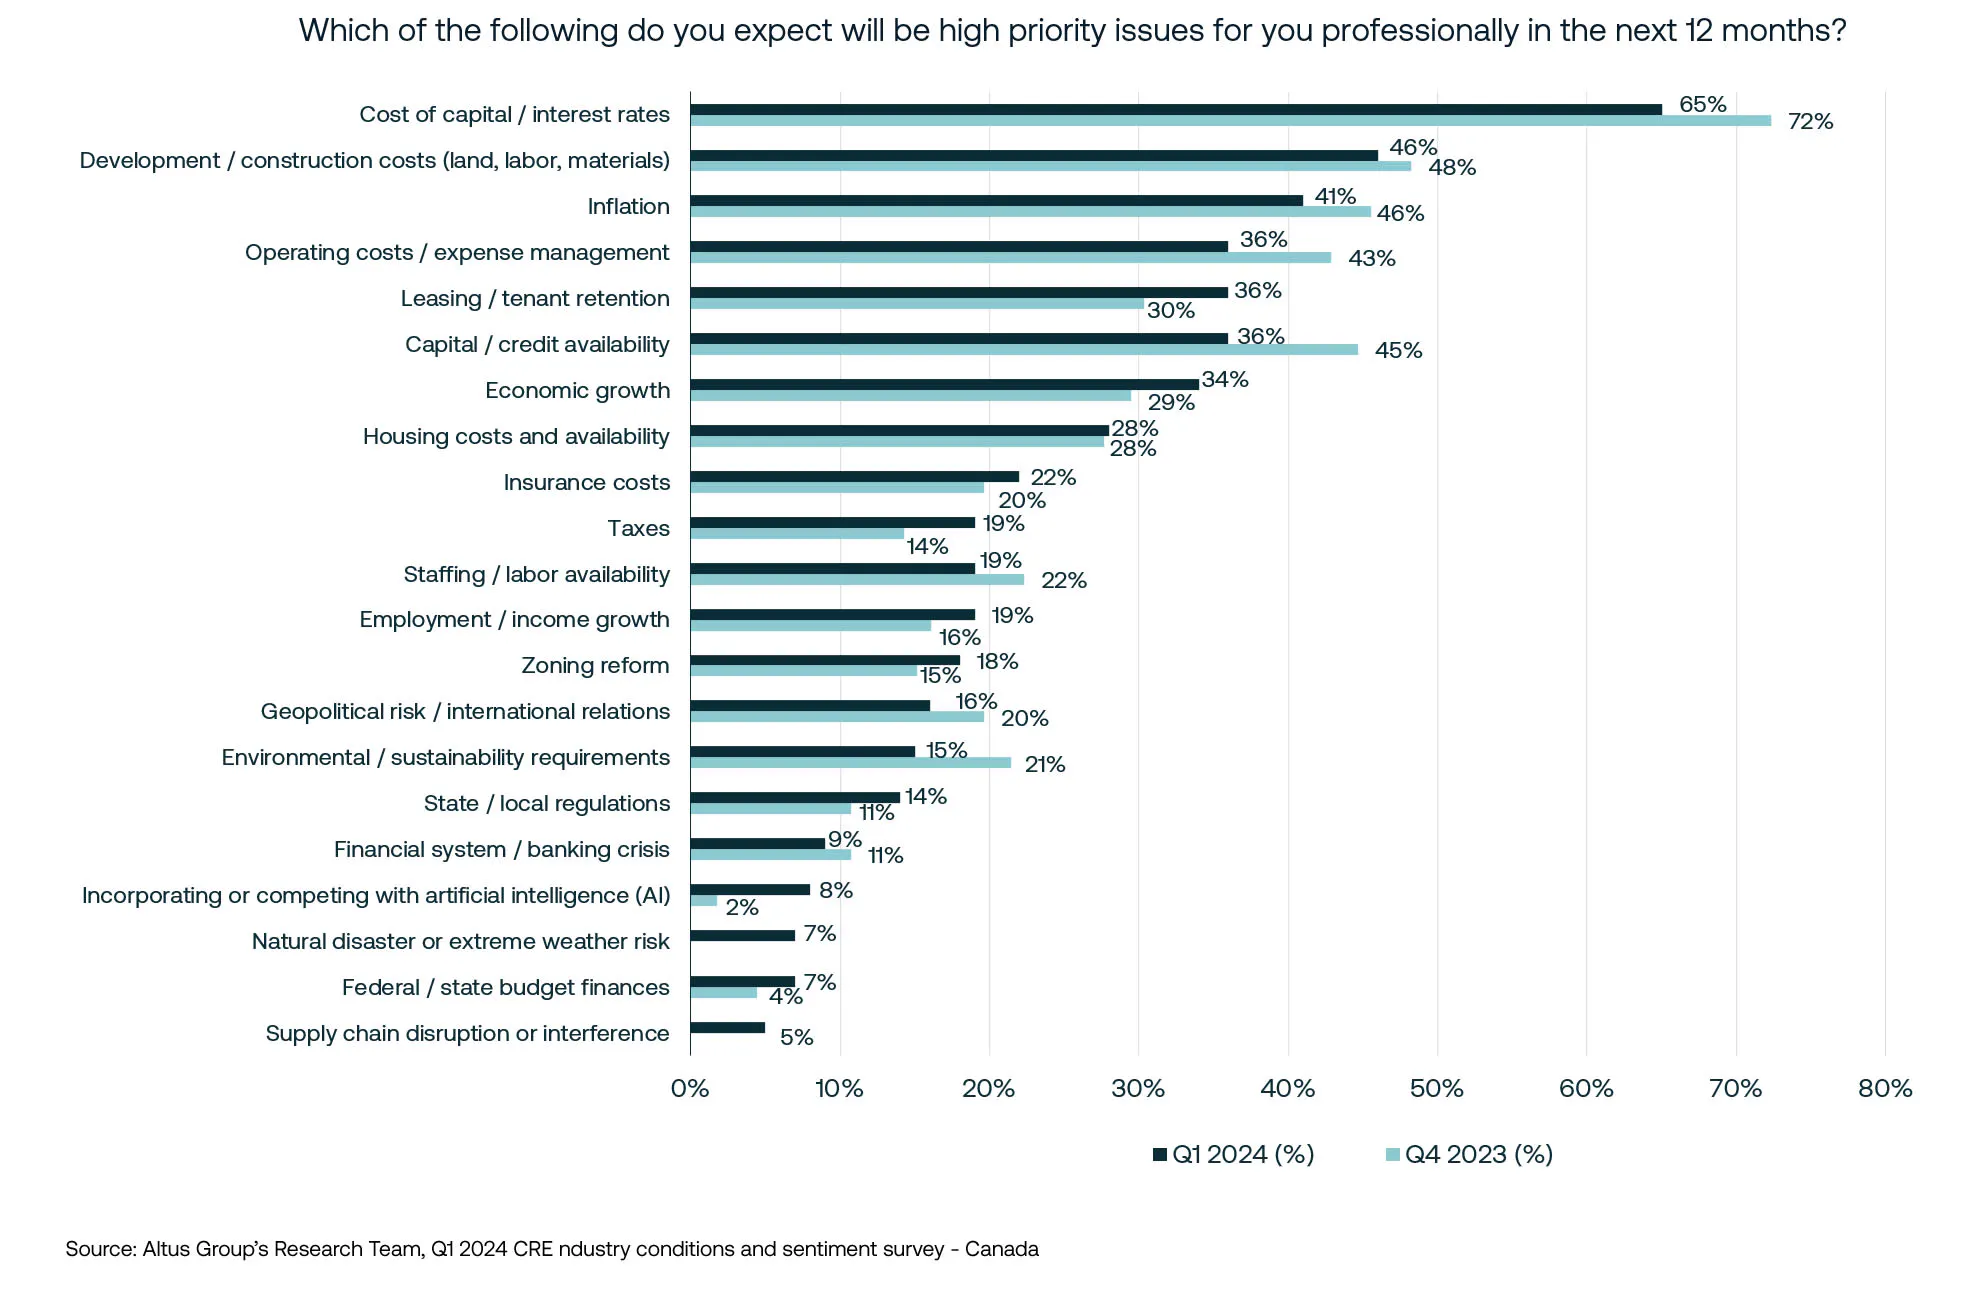
Cost of capital, development costs, and inflation topped the list of expected priorities over the next 12 months for the third consecutive quarter. Still, the percentage of respondents citing each declined slightly from the prior quarter.
Property-specific concerns such as operating costs / expense management and tenant retention rounded out the top five near-term priorities as a result of capital availability concerns experiencing a notable drop in Q1 2024 – from 45% to 36%. Leasing / tenant retention was the only concern among the top five that increased between Q4 2023 and Q1 2024, with the percentage of respondents citing this concern jumping from 30% to 36%.
Note: “Supply chain disruption or interference” and “Natural disaster or extreme weather risk” were added to the Q1 2024 survey, so a comparison to the prior quarter’s results was not possible.
Figure 3 – Canada survey results: Which of the following do you expect will be high priority issues for you professionally in the next 12 months?
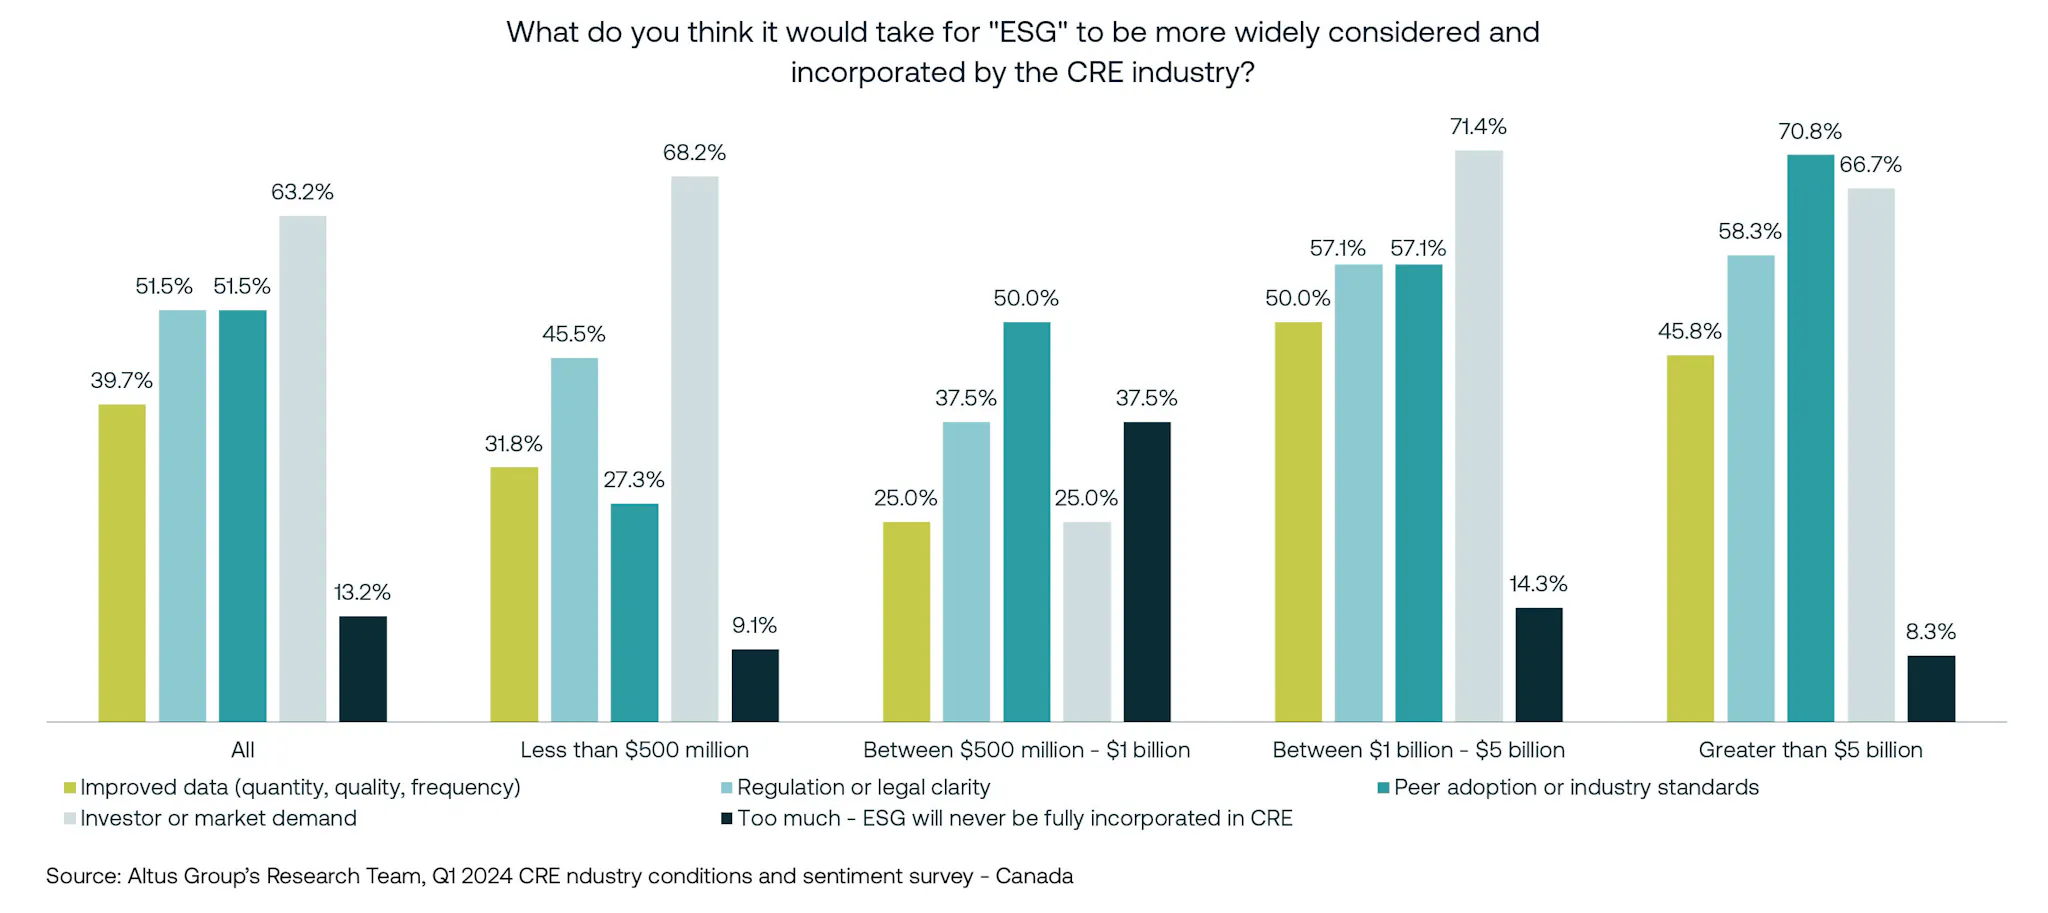
ESG in need of investor or market demand
Nearly two in three Canadian respondents (63.2%) believe ESG needs “investor or market demand” for it to be more widely considered and incorporated by the CRE industry. More than half of the respondents identified “peer adoption or industry standards” and “regulation or legal clarity” as the next most popular responses, both with 51.5% of the responses. Overall, Canadian respondents appear to be more confident in the acceptance of ESG in the CRE industry than their American counterparts – as Canadian responses were higher across all options, except for “too much – ESG will never be fully incorporated into CRE”, with 13.2% of Canadians and 21.8% of Americans agreeing with this statement.
Figure 4 – Canada survey results: What do you think it would take for “ESG” to be more widely considered and incorporated by the CRE industry

Ask the expert: Victor Cotic, Executive Vice President, Sales Representative | National Investment Services, Colliers Toronto Brokerage
What is your assessment of the current industrial market cycle in the Greater Toronto Area (GTA)?
It’s no surprise that rising interest rates have had a significant and direct impact on commercial real estate. Even the otherwise resilient GTA industrial market has felt the pressure of the economic uncertainty caused by inflation and interest rates.
The market consensus is that interest rates have stabilized, which should mean the bottom of the current market cycle. On the other hand, rental rate projections, which are the other primary driver of industrial valuations, are slowing down. This past quarter, we saw a shift from annual growth rates of +/- 20% to those aligned with inflation. The slowing in rental rate growth is working its way through valuations. This may put the GTA industrial market closer to the middle of the market cycle.
Regardless of the cycle, industrial investment has historically been undersupplied, with more buyers than sellers, and this remains the case today. Real estate investors are generally bullish long-term on the GTA’s industrial investment market and want to add to their portfolio.
What have been the main challenges to completing transactions and how can these be overcome?
Two common challenges are shifting market conditions, particularly interest rates, and concerns that arise in due diligence. The best way to manage both potential challenges is to overcome hesitation with a thoughtful and expert approach to the transaction, accelerating its timeline. This can be done by completing proper pre-marketing due diligence. Before going to market, expert advisors with sector-specific knowledge can quickly address these challenges by reviewing leases, environmental and building condition reports, and operating statements before soliciting buyers. This pre-marketing due diligence allows for quicker transactions, reduces the risk of withdrawal or price reductions, and minimizes exposure to potential shifts in market conditions.
What is the investor profile in the GTA’s industrial market? And who is divesting?
Last year, we saw institutional investors divest some of their industrial properties as the rapid change in interest rates caused allocation and redemption issues and prompted sales. As a result of more expensive financing, particularly construction financing, institutional investors sold existing buildings to re-capitalize and fund new developments in their pipelines.
With institutional investors less active, private investors became more significant players on the buy side. In the last five years, private investors’ representation has grown from roughly 10% of the GTA industrial market to over 30%, remaining relatively consistent amidst the challenging market conditions of the past 24 months.
Over the past year, foreign institutional investors have also entered the GTA industrial market. GIC Private Limited, a Singaporean sovereign wealth fund; Brookfield Properties; and TPG Inc., an American private equity firm, have all recently invested in GTA’s industrial sector.
In the current interest rate environment, value-added real estate investments are taking the spotlight, with investors seeking higher risk-adjusted returns. However, if interest rates were to drop, it would likely prompt an increase in institutional capital to refocus on core Class A opportunities at returns aligned to previous years. Domestic institutional investors are well-capitalized, and I expect an increase in their acquisition activity in the short term.
Is it easier now to underwrite an investment with the recent stability in interest rates?
Absolutely! However, “stability” is relative as bond rates continue to fluctuate, albeit significantly less than in 2022 and 2023. In the past, we saw market rental rates achieve an upward trajectory of 20% year-over-year growth. If market rental rates continue to stabilize, another key variable in underwriting real estate investments will also be simplified.
What key trends do you foresee in the GTA’s industrial investment market for the balance of the year?
GTA industrial availability rates have been increasing rapidly, from a low of 0.6% in Q2 2022 to 3.1% currently. The rise in availability has released much of the upward pressure on market rental rates, and we have seen rental growth come off from +/- 20% down to +/- 3%. The market remains extremely tight at 3.1% availability, and we expect market rents to remain stable in the GTA.
We should expect the year’s balance to reflect 2023 but with potentially less transaction volume in the industrial investment market. Those looking to divest did so in 2023 and have primarily re-allocated that capital, resulting in less sales activity in 2024.
Why should investors work with you for their commercial real estate needs?
Working with an experienced advisor is critical to navigating challenging market conditions. With over 20 years of experience in investment sales, I provide expertise and best practices across various transaction types and markets. Our team prioritizes client goals, pre-marketing due diligence, and eliminating risk for an efficient and effective transaction. Additionally, Colliers offers a suite of tools and services, including Debt Advisory, for those looking for a full-service approach to their real estate needs.
Source Renx.ca. Click here to read a full story.

Major real estate data surveys are reporting mixed signals for the Canadian office sector this quarter, with positive net absorption but a higher vacancy rate (18.4 per cent) nationwide led by upticks in both Toronto and Vancouver.
Another significant ongoing trend is the reduction in office space under construction, which dropped to 9.1 million square feet across the country – its lowest level since 2011 according to CBRE’s Canada Office Figures Q1 2024 report. No new office buildings broke ground in the quarter.
“The Canadian office market reported 439,000 sq. ft. positive net absorption to start off the year,” the report’s executive summary states.
“This is the first quarter of positive net absorption since Q3 2022 and was bolstered by pre-leased new supply in Vancouver, offsetting further softness in Toronto.”
The long, bumpy and geographically fragmented recovery from the COVID-19 pandemic and the ongoing hybrid home/office working models are reflected in the data.
Vacancy up in Vancouver, but market remains strong
While Vancouver remains one of the strongest office markets in North America with a vacancy rate of 9.5 per cent, it did increase slightly in Q1.
And while some secondary markets are showing signs of continued improvement, Toronto also experienced a rise in overall vacancy to 19.2 per cent, including 18 per cent in the downtown.
Both Vancouver and Toronto were impacted by space dumped by WeWork as part of its restructuring process which returned to the market, CBRE notes.
There is almost five million square feet of additional space under construction in the Greater Toronto Area (more than half the nationwide total), with about 54 per cent of it preleased.
“While vacancy has continued to increase nationally, we are starting to see some green shoots in Canada’s downtown office markets,” CBRE Canada chairman Paul Morassutti noted in the report.
“In each of the last three quarters, five of the 10 cities tracked recorded declining downtown vacancy on a quarterly basis. It doesn’t mean things have fully stabilized, but it offers some much-needed optimism for the heavily scrutinized office market.”
Helping mitigate vacancy stats are new office-to-residential conversion projects, which removed an additional 870,000 square feet from inventory as 13 projects in eight markets moved forward. The average vintage of these buildings from the C- and B-class inventories is 1985.
Following are snapshots of 11 Canadian markets, with data provided from the CBRE report and augmented from other reports where noted.
Toronto
Downtown vacancy climbed to 18 per cent, while suburban vacancy hit 20 per cent, mainly due to new direct space going onto the market.
Absorption for the quarter was -696,465 square feet in a total office inventory of 171.7 million square feet citywide. Sublet space comprises about 22 per cent of the total.
While the downtown class-A vacancy rate was 15.5 per cent, a much higher suburban class-A vacancy (23.6 per cent) meant that overall, class-A vacancy was almost the same as vacancy for all classes, at 18.8 per cent.
Avison Young also released data which shows GO Transit trips in Toronto settled at about 60 per cent of pre-pandemic norms in 2023.
The data shows an average of about three million trips per month on the commuter rail service, though there was a rise through the fall to just under four million trips in November. That compares to about five million monthly trips in 2019.
“Considering GO rail as one of the primary public transit options for office workers commuting downtown, the increase in ridership suggests a steady return of workers to an in-office environment,” the post states.
“However, since vacancy rates are typically a lagging indicator, this ‘return’ has yet to translate into the overall vacancy rate.
“We anticipate that higher-end or trophy properties, which have generally maintained lower vacancy rates, will experience a positive impact first before demand trickles down to the class-A and eventually class-B office market.”
Vancouver
The addition of 1.15 million square feet of new supply during the quarter bolstered the city’s overall inventory to 53 million square feet. Because most was pre-leased, it also led to 1.04 million square feet of absorption.
However, the city’s downtown vacancy rose to 10.9 per cent and suburban vacancy was at 8.7 per cent – for a citywide total of 9.5 per cent.
Sublet space dropped to 24.4 per cent of that, with about five million square feet of space available in total (2.4 million square feet of direct versus 667,000 square feet of sublet).
1.96 million square feet of new space remains under construction, all outside the downtown.
Montreal
Downtown vacancy declined for the first time in six quarters, with class-A activity trimming it to 17.7 per cent. Suburban vacancy was up slightly to 18.7 per cent, and citywide the rate was up slightly to 18.1 per cent.
Market bifurcation is continuing, with the majority of activity resulting from tenants “targeting best-in-class buildings with great amenities,” the report states. With over two million square feet under construction, this trend is unlikely to slow.
Overall absorption was -192,000 square feet (total inventory 78 million square feet), driven mainly by a drop of over 300,000 square feet in the suburban markets.
Calgary
The region’s total inventory of 68.6 million square feet experienced a slight increase to 28 per cent vacancy, with 30.3 per cent in the downtown and 24.4 per cent in the suburbs.
Net absorption and leasing activity were almost flat, and a 127,488-square-foot suburban medical office building was the lone Q1 delivery.
Edmonton
The city recorded its third straight quarter of declining vacancy, with overall vacancy down to 21.1 per cent (22.3 per cent downtown, 19 per cent in the suburbs).
Much of the activity, which resulted in just over 40,000 square feet of absorption, occurred with large-scale users in the downtown.
This has led to a slight increase in average class-A net rents, which were $19.53.
Regina
The city’s availability rate continued its recent decline, dipping to 15.5 per cent, according to an Avison Young Q1 report. That’s down significantly from 17.75 per cent in Q1 2023, and reflects a market with no new recent space deliveries – and none on the horizon.
Vacancy for class-A space is at 8.8 per cent, and asking rents for these properties in the city range from $22 to $34, the report states.
Winnipeg
Completion of the downtown Wawanesa Tower delivered 380,000 square feet of fully pre-leased space to the market. As Wawanesa consolidated its employees from across the city, a move from 191 Broadway freed up 68,000 square feet in that property.
All the activity raised Winnipeg’s downtown vacancy to 18.6 per cent, while suburban fell to 10.2 per cent, for a citywide average of 16.2 per cent. The region has an inventory of 14.4 million square feet.
London
Demolition of the former London Free Press building removed 145,000 square feet of office space in the downtown area, leading to a decline of citywide vacancy to 23.7 per cent and a revised office inventory of 6.3 million square feet.
Waterloo Region
The region’s comparatively healthy office market saw vacancy rise slightly to 13.9 per cent, but there is no new space in the construction pipeline. The region’s inventory stands at 16.1 million square feet of space, with most of it (11.1 million square feet) considered suburban space.
Average net rents continued a year-long decline, dipping to $21.66 in Q1.
Vacancy is heavily focused on the downtown, which is at 22.5 per cent compared to 10 per cent in the suburbs.
Ottawa
Ottawa’s vacancy rate dropped 30 basis points to 13 per cent, but its inventory also continued to fall – to 40.8 million square feet – thanks to the removal of aging buildings for office-to-residential conversions.
The latest is 200 Elgin St., which will be the fifth downtown conversion in recent years.
The market has seen only one quarter with rising office inventory since late 2021.
Absorption of 183,172 square feet in the suburbs offset -92,402 square feet in the downtown.
In its own report, Colliers reports availability of 14 per cent across the city and vacancy of 12 per cent. It notes almost 440,000 square feet of net absorption during the past six months.
One less encouraging note in the Colliers report is that the city’s return-to-office stats lag most other major cities, at just 54 per cent of pre-COVID levels (Toronto is at 78 per cent, Montreal 67 per cent and Vancouver 72 per cent).
Halifax
Conversions are also gaining traction in the Halifax Regional Municipality, where the overall office vacancy rate held steady at 14.1 per cent, but inventory declined to 12.9 million square feet.
Interestingly, this market has also registered year-over-year growth in rents for the past five quarters, hitting $18.27 for class-A properties in Q1 2024.
There is 1.7 million square feet of space available for lease, but only 5.7 per cent of that is sublet space. It is also evenly distributed among the downtown and suburban markets.
Source Renx.ca. Click here to read a full story.

But bid-ask spread is decreasing, raising hopes for more transaction activity, Altus Group survey finds
Managing their existing portfolios will be the primary focus for 49 per cent of the Canadian commercial real estate industry executives who participated in Altus Group’s Q1 2024 Commercial Real Estate Industry Conditions & Sentiment Survey.
After managing existing portfolios, the biggest priorities according to the respondents were: raising capital (18 per cent); deploying capital (15 per cent); de-risking portfolios and divesting (10 per cent); and reassessing (eight per cent).
The cost of capital, development costs and inflation topped the list of expected priority issues over the next 12 months for the third consecutive quarter. Still, the percentage of respondents citing each declined slightly from the Q4 2023 survey.
Operating costs/expense management and tenant retention rounded out the top-five near-term priorities, while concerns about capital availability experienced a notable drop. Leasing/tenant retention was the only concern among the top five which increased between fourth quarter of 2023 and the first quarter of 2024.
The Altus research team surveyed 214 industry participants, representing a range of organization types and functional areas, from at least 55 Canadian firms between Jan. 23 and Feb. 9.
Asset pricing, interest rates and cap rates
Half or more of the respondents characterized land/development, hospitality and multifamily properties as “overpriced,” while some viewed retail, office, multifamily and land to be “underpriced.” Most respondents characterized the retail and industrial sectors as being “fairly priced.”
The survey’s findings suggest the bid-ask spread, which contributed to lower transaction activity in 2023, might be compressing. This could lead to increased investment and transaction activity if the trend holds.
Forty-seven per cent of respondents expected interest rates to remain stable over the next 12 months, while another 47 per cent expected them to decrease, with only six per cent anticipating an increase. The percentage of executives expecting rate decreases jumped by 28 percentage points from the previous quarter.
One-third of respondents expected capitalization rates and cap rate spreads to increase over the next 12 months.
Distress and transaction activity
Fifty-eight per cent of respondents expected commercial real estate distress to increase over the next 12 months, down 20 percentage points from the previous quarter. Just 18 per cent had a high conviction in their directional call, a 22 percentage point drop from the fourth quarter.
Along with the expected increase in distress, 48 per cent of participants anticipated investment transaction activity to pick up in the coming year, up 19 percentage points from the prior quarter.
Seventy-one per cent of respondents planned to either buy, sell or both over the next six months, up from 67 per cent in the prior quarter.
Those from companies with commercial real estate exposure of between $500 million and $1 billion increased their transaction intentions by 26 percentage points; those with between $1 billion and $5 billion in investments increased theirs by 13 percentage points.
While 29 per cent of respondents indicated no intentions to transact in the near term, that was three percentage points lower than in the previous quarter.
Sixty-three per cent of respondents expected their geographic footprint to be of a similar size a year from now, while 24 per cent anticipated that it would be expanded and 13 per cent believed they would be in fewer markets.
Capital availability
While the overall expectation is that capital availability will be low over the next 12 months, net expectations have broadly improved since the previous quarter.
Survey participants expected the least amount of capital availability from real estate investment trusts and asset managers. They anticipated greater availability of equity capital from individuals, family offices, private equity and hedge funds.
Expectations for securitizations, mortgage REITs and insurers were heavily constrained. Canadian commercial real estate professionals expected debt funds and banks to have the greatest amount of capital availability over the next year.
The expectation for Canadian bank capital availability is in stark contrast to the belief in the United States.
Environmental, social and governance considerations
Thirty-nine per cent of respondents “moderately” factored environmental, social and governance (ESG) considerations into their capital decision-making process.
Respondents from institutions with greater than $5 billion in commercial real estate under management showed the most ESG consideration, with 67 per cent saying it either “significantly” or “moderately” affected their capital decisions.
Nearly two-thirds of respondents believed ESG needs “investor or market demand” for it to be more widely considered and incorporated by the commercial real estate industry. “Peer adoption or industry standards” and “regulation or legal clarity” were the next top responses.
Canadian respondents had higher confidence in ESG being adopted into the industry than their American counterparts.
Source Renx.ca. Click here to read a full story.

The Canada CRE sector experienced significant growth and resilience amidst evolving market dynamics, showcasing its strength and adaptability according the CBRE and JLL’s latest Canadian real estate market reports.
Leveraging technology-driven solutions has emerged as a critical strategy for capitalizing on this momentum and sustaining success in 2024 and beyond. This extensive guide delves into five indispensable strategies for automating the marketing and leasing process, empowering CRE professionals to navigate the complexities of the market and seize new opportunities in the year ahead.
Achieve higher profits
A revenue focused CRE solution must prioritize driving higher revenue while simultaneously lowering operational costs. When it comes to driving higher revenue, the two main levers are: Increasing lead and deal volume. Equally crucial is ensuring that executed deals are economically favourable.
Automation plays a pivotal role in achieving these goals by streamlining workflows, reducing manual interventions, and eliminating data fragmentation. By automating lead generation processes, CRE professionals can efficiently manage incoming inquiries, prioritize leads, and focus efforts on closing high-potential deals. The right technology partner can help you efficiently manage your deal pipeline using real-time, portfolio-wide data, that will support optimal profitability and accelerate deal velocity.
Maximize marketing outcomes
Successful marketing requires juggling multiple channels, like email, brochures, listing sites, and social media. Unfortunately, managing each platform individually can be resource-intensive and lead to inconsistencies, outdated information, and inaccuracies across your marketing efforts. Here’s where automated syndication tools come in. They streamline the distribution of your property listings across CRE platforms, marketplaces, and even your website. These tools seamlessly update details and availability, augmenting lead generation and overall marketing effectiveness. Additionally, automation simplifies listing updates, ensuring timely and consistent content everywhere. This significant reduction in manual effort empowers you to devote your attention to what truly matters: analyzing marketing performance and developing strategic initiatives.
Elevate lead-to-lease management
Efficient management of the lead-to-lease pipeline is critical to maximizing deal throughput and minimizing cycle times. However, disparate systems often hinder this efficiency, leading to delays due to disconnected processes, siloed communication, and inaccurate tenant information.
The right CRE solution addresses this issue by centralizing valuable data like number and type of leads, tour activity, lease expiration dates, and tenant information. This comprehensive portfolio overview provides full transparency and facilitates faster decision-making, empowering your staff to close better deals, faster.
Additionally, leveraging advanced approval workflows eliminates bottlenecks and expedites deal execution, while sophisticated tools automate letter of intent (LOI) creation, guaranteeing customized and accurate documents with minimal effort. The ideal software empowers your staff to seamlessly track communication, tasks, and activities in real-time within one platform.
Streamline deal evaluation
In today’s fast-paced business environment, real-time data access is crucial for informed decision-making. Firms need key information to evaluate deals, including the start date, rent schedule, tenant improvement costs, and lease term.
More quantitatively focused firms also require net effective rent (NER) – the discounted net rent averaged over the lease term after all expenses. The most advanced firms then compare NER to the underwriting budget, annual budget, prior lease, or a combination of these.
However, disconnected systems force dealmakers and asset management teams to manually track and compare this data. Resulting in errors, miscommunication and efforts wasted.
A connected deal management solution streamlines this process by automatically calculating NER and pulling relevant comparisons, eliminating manual effort. The solution should integrate seamlessly with the core property management system, allowing real-time access to underwriting budget, annual budget, and previous lease data.
Furthermore, approval workflows can be tied to these economic comparisons, empowering managers to approve deals with full transparency into the financial performance against budget. This data-driven approach ensures only the most profitable deals are closed, ultimately driving higher revenue.
Simplify lease document management
The creation and management of lease documents are critical components of the leasing process. Unlike apartment leases, commercial leases were once considered too complex to automate. Fortunately, this perception has shifted.
New automation solutions offer a simplified approach to generating even intricate lease documents, reducing processing time by 80-90% and minimizing administrative overhead.
Sophisticated lease automation platforms enable CRE professionals to create lease and addenda templates, store clauses and options in libraries, create groups of clauses and options with a push of a button and minimal intervention. These functionalities, along with in-app editing, approval, and tracking, ensure a seamless signing process. Additionally, robust e-sign functionality facilitates secure and efficient electronic signing, further enhancing operational effectiveness.
Achieve success
The dynamic nature of the CRE market demands constant innovation. To stay ahead, CRE organizations can leverage easy-to-implement technology that streamlines workflows, marketing efforts, deal pipeline visibility, data analytics, and lease management in a single connected solution. This empowers CRE professionals to optimize operations, drive revenue growth, and maintain a competitive edge – making you a leader in the evolving CRE landscape.
Source Renx.ca. Click here to read a full story.
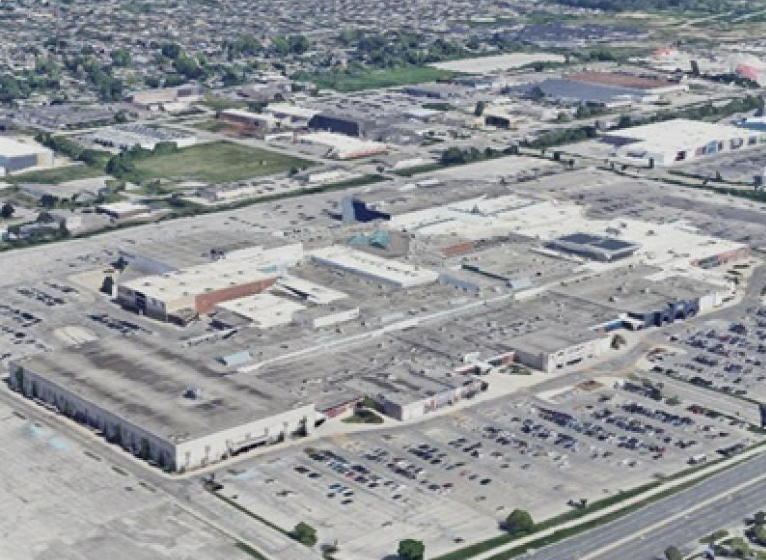
A long-vacant former Sears store at Primaris REIT’s Devonshire Mall in Windsor will soon be demolished as part of a redevelopment that will open up land for future uses.
The space, which has a basement and two floors above ground, has remained largely vacant since Sears closed in early 2018. It was temporarily used by Spirit Halloween as a pop-up outlet and served as a COVID-19 vaccination clinic for 10 months beginning in June 2021.
The removal of the Sears building will free up 18.5 acres and create an opportunity to reconfigure the outside entrance at that end of the mall.
“The cost of restoring it to modern environmental and safety standards was very high,” Primaris REIT chief executive officer Alex Avery told RENX. “So we thought rather than spending a lot of money trying to repurpose that, we would do what’s right for the mall and create a new high-impact entrance like we have in other parts of the mall.”
Primaris took ownership of Devonshire Mall at the end of 2021 as part of its $800-million acquisition of six shopping centres and two related properties from Healthcare of Ontario Pension Plan.
Plans for Devonshire Mall
Avery said Primaris is in advanced discussions with a number of leading national retailers for two end cap stores that will be located on either side of the new Devonshire Mall entrance. They’ll combine for approximately 50,000 square feet of space and will be accessible from both the interior and exterior.
With a gross leasable area of 874,500 square feet, Devonshire Mall is the largest enclosed shopping centre in Ontario outside of the Greater Toronto Area. The 160-store mall, which was built in 1970 and renovated in 2018, also offers 5,404 parking stalls at its 3100 Howard Ave. location.
As of January, Devonshire Mall had a 12-month rolling sales average of $687 per square foot.
Avery said the mall has been performing well and its prospects should further improve with Windsor’s population growth and the benefits it will receive upon the completion of a Stellantis/LG Energy Solution electric vehicle battery manufacturing facility that’s expected to create 2,500 new jobs, the Gordie Howe International Bridge that will provide another connection to Detroit, Mich., and a large new hospital.
Tenant interest in Devonshire Mall
“We have a lot of very keen interest from new-to-market retailers,” Avery said.
New tenants confirmed to locate in Devonshire Mall later this year are:
- The Canadian Brewhouse, which will move into the former Buffalo Wild Wings outlet that closed in 2023;
- home goods, cosmetics and accessories retailer Miniso, which will be in the former food court area;
- and Korean-American fusion restaurant Today Cafe, which will open in the food court.
“We haven’t nailed down exactly what we’re going to do with the 18 acres, but there is a tremendous amount of flexibility and potential at that end of the property,” Avery noted. “In speaking with the city, they’re quite keen to see the potential for residential to be added to the site.”
Acquisitions, dispositions are in the works
Primaris is Canada’s only enclosed shopping centre-focused real estate investment trust, with a 39-property portfolio totalling about 12.5 million square feet and valued at approximately $3.8 billion (at its share) as of Feb. 14, when it issued its 2023 year-end financial results.
The Bank of Canada hasn’t yet reduced interest rates, which has presented challenging conditions for property transactions overall. But Primaris had a relatively low debt-to-asset ratio of 38.3 per cent and $654.3 million in liquidity at the end of last year and is well-positioned to take advantage of market opportunities.
Avery said the trust is advancing discussions regarding both acquisitions and dispositions.
“The properties that we’re selling are much, much smaller properties — strip centres, excess land parcels and things like that — and that market hasn’t been as impacted by market illiquidity,” Avery said.
Residential intensification opportunities
The excess lands Primaris owns include four acres north of Toronto’s Dufferin Mall, just south of Bloor Street. The fully entitled, zoned and severed site is close to the Dufferin subway station and can support 1,300 residential units.
“On a regular basis we have people approaching us about acquiring the four acres,” said Avery. “We’ve had similar interest on acquiring the whole property, including the mall.
“We’re still working our way through what Dufferin Mall will look like in 20 years. What is very clear is that you’ve got 21 acres of land sitting adjacent to a subway station in central Toronto.
“Look at something like The Well that Allied and RioCan developed, and it’s a pretty spectacular project. And that was on eight acres.”
Avery said municipalities across Canada would like to see residential density added to Primaris-owned retail sites where feasible.
The trust’s primary focus remains on acquiring and managing shopping centres, so Primaris is open to partners that can either entirely acquire those potential intensification sites or enter a joint venture of some form.
Source Renx.ca. Click here to read a full story.

2023 was the year the City of Toronto started taking a harsh look at its Mid-Rise Building Design Guidelines.
In June 2023, council requested moving forward with community consultations regarding proposed changes to the Rear Transition Performance Standards, changes that aim to replace the “wedding-cake” effect caused by angular planes and current guidelines.
Next up would be the Tall Building Design Guidelines, which were adopted city-wide back in 2013.
Toronto’s tall building guidelines, although not perfect, are a crucial tool in shaping our city. Their significance becomes more evident when compared to many places where such a document simply does not exist.
It is then that you truly see how urban design suffers.
Consider the requirements for limiting floor plans and how the buildings should “meet the ground” for example. A quick look at several cities in the Middle East and East Asia shows how crucial these guidelines are and what the city looks like without them, when towers have no limitation on floor plates and they grow out in the centre of a big surface parking area.
Then we will start appreciating what Toronto’s Tall Building Design Guidelines have achieved.
Compared to other manuals, Toronto’s Tall Building Design Guidelines are clear, not overly strict and offer enough flexibility for design. Whether architects actually take advantage of that flexibility is a separate issue.
Where current guidelines fall short
With that positive disclaimer, here are the aspects where the guidelines are falling short (pun intended):
First, tall building guidelines are intended to provide a degree of certainty and clarity in interpretation, and while they are supposed to offer some flexibility in application, they wield significant influence in determining the height of our buildings, because they apply to the evaluation of all tall building proposals across the city.
One of the main objectives of these guidelines is to ensure tall buildings fit within the existing or planned context and facilitate an “appropriate” transition to the surrounding lower-scale buildings. Introducing a 45-degree angular plane from lower-scale areas — which in Toronto mostly means areas designated as “Neighbourhoods” in the Official Plan (OP) land-use map — is one of the measures the guidelines implement to ensure this transition.
What is the problem with that?
Take properties along the Bloor-Danforth subway line, for instance. Those designated as mixed-use in the OP tend to be shallow and back onto the neighbourhoods. Try applying the 45-degree angle to these properties near the subway stations — which are by no doubt underutilized — to determine the potential permitted height.
What you get is . . . well, no tall buildings at all!
Even beyond that, why should height even be a question for tall buildings? Tall buildings offer the most efficient way of providing more homes while using less land. So, why impose a limit at all?
Construction costs and market demand will naturally dictate the height anyway.
What is an “appropriate” tall building site?
Next, identifying a site “appropriate” for a tall building development.
To evaluate a site’s suitability for tall buildings, the city considers its land use as well as the location and dimensions, particularly its depth. In this evaluation, there is a significant emphasis on ensuring the location and density of a prospective tall building are appropriate for the existing context of the site – which in Toronto predominantly consists of low-rise, low-density neighbourhoods.
However, the question of whether the existing context of a site is appropriate for the opportunities presented by its location is greatly overlooked. As a result, tall buildings are frequently placed in undesirable locations, like highways.
So, it seems contradictory when those who argue against tall buildings as desirable residential options and advocate for pushing them away from neighbourhoods – citing areas along major roads as the only “appropriate” location for constructing them – are often the same individuals using the “bad outcomes” as a reason for deeming tall buildings undesirable. This approach refuses to give tall buildings a fair chance to evolve into vibrant communities from the outset.
Another restriction related to the form of tall buildings is the limitation of the floor plate to 750 square metres. The initial idea behind this restriction was to create a sleek and slender silhouette.
However, given the housing crisis we are in and the years of delivering poorly designed units to make developments financially viable within these constraints, the recent recommendation by housing minister Sean Fraser’s Affordability and Climate Change Task Force to increase the floor plate limitation seems timely. It is an adjustment that could relieve the rigid constraints and hopefully improve the quality of units.
Revising our height and floor-plate constraints is crucial to ensuring we can deliver much-needed housing in the crisis we are facing.
But how about taking it a step further? How about refraining from imposing overly restrictive form-related constraints on developments and instead focusing on factors that would improve quality.
Of course, floor-plate limitations are necessary to some extent, but they should not be overly deterministic. We need to start looking at our regulatory tools more holistically and systematically.
The impact of Inclusionary Zoning
Take the Inclusionary Zoning for example, a policy aimed at creating mixed-income housing by mandating a certain percentage of affordable units in new residential developments.
Currently, private developers must allocate five to 10 per cent of developments of more than 100 units (and larger than 8,000 square meters of residential gross floor area) as affordable housing, contingent upon the development’s location and whether it secures affordable ownership units or affordable rental units. This requirement is planned to incrementally increase to eight to 22 per cent by 2030.
It neither makes sense nor is practically sustainable in the long term when 90 per cent of building owners — many of whom could be first-time homebuyers new to the housing market — are taxed to bear the affordability burden of the remaining 10 per cent. However, if a height or density bonus was implemented, it could offer a more feasible and equitable solution for accommodating affordable units.
Moreover, easing strict regulations regarding height and density could create space for prioritizing the design of our tall buildings and the resulting aesthetics of our cities. While the guidelines touch upon design and articulation as essential aspects, they fail to enforce them.
Imagine this: What if we didn’t allow the use of the words “height” and “density” at Design Review Panel discussions and shifted the focus solely to “design” and in doing so ensured we have a diverse panel to enable a broader range of voices and design approaches to contribute?
This shift could elevate the significance of this crucial committee and help create urban landscapes we can take pride in — something we lack today.
Toronto is currently grappling with a serious design challenge. No doubt economic constraints play an important part, but we must explore ways to break away from the trend of repetitive windows and uninspiring facades in tall buildings, and build beautiful and distinctive urban spaces that are representative of our diverse and vibrant society.
A call for a cultural shift
But above all, and even more fundamental than shifting the focus of our regulatory tools, we need a cultural shift.
This is something our design guidelines have not yet addressed and may never even try to. We need to change how we perceive living in tall buildings and dense urban neighbourhoods as a society.
Times are changing rapidly, and so are our needs and challenges. To ensure we keep pace, public support, or at least stigma reduction, is crucial.
In a couple of decades, billions more people will be living in cities. The only environmentally and economically sustainable way to accommodate this new population is to create tall, dense and charming neighbourhoods designed to foster a human scale: neighbourhoods that prioritize the pedestrian experience, encouraging social and economic interactions at various levels.
Cities that successfully achieve this will lead the way in the future while those that fail will be left behind, missing out on the enormous growth and prosperity this new way of living can bring.
I hope Toronto will make the right decision.
Source Renx.ca. Click here to read a full story.