Office of Superintendent of Financial Institutions Says Lower Quality Office Buildings Pose More Risk
Commercial real estate has drawn a red flag from the agency that regulates Canada’s financial industries, particularly the office sector.
The Office of the Superintendent of Financial Institutions said corporate credit and commercial real estate — particularly the construction, development and office sectors — continue to face stress and a high degree of uncertainty.
“While market-based and core funding liquidity sources are available, prior downturns and stress events have demonstrated that these conditions can change quickly,” the agency said in its annual risk outlook for the fiscal year 2024-2025
The independent federal government agency reporting to the Minister of Finance added that “wholesale credit risk, including risk from commercial real estate lending as well as corporate and commercial debt, remains a significant exposure for financial institutions. Economic uncertainties and changes in these markets are impacting the risk environment. Current interest rate levels have produced challenging refinancing conditions for some commercial and corporate borrowers, and the conditions could negatively affect wholesale credit markets in the coming year.”
It added that higher interest rates, inflation, and lower demand have put commercial real estate “markets under pressure. We expect these challenges to extend into 2024 and 2025.”
While new office construction has hit its lowest level since 2011, CBRE reported last month that the national downtown vacancy rate reached 19.5% as more supply was added to the market.
The Office of the Superintendent of Financial Institutions pointed to the office sub-segment of the commercial real estate market as facing additional changes as companies adopt hybrid work environments, leading to rising vacancies and declining asset values.
“Lower quality office buildings face more acute risks while higher quality older properties have also experienced pressure from reduced demand for office space,” the agency noted.
It added that other aspects of commercial real estate, including the construction market and industrial sector, face challenges from reduced demand.
The Bank of Canada has also said it is monitoring commercial real estate closely. Now the Office of the Superintendent of Financial Institutions plans to monitor lending activities to assess borrower and portfolio vulnerabilities, account management and underwriting practices and loan loss provisioning.
The regulator also monitors the residential housing market and notes that 76% of the mortgages that were outstanding as of February 2024 will be up for renewal by the end of 2026.
“Canadian homeowners who will renew their mortgages during this time period could potentially face a payment shock. This payment shock will be most significant for homeowners who took out mortgages when interest rates were lower in 2020 to 2022,” said the regulator.
GIC and Dream Industrial REIT’s Purchase of Summit Industrial Income REIT Provided Boost
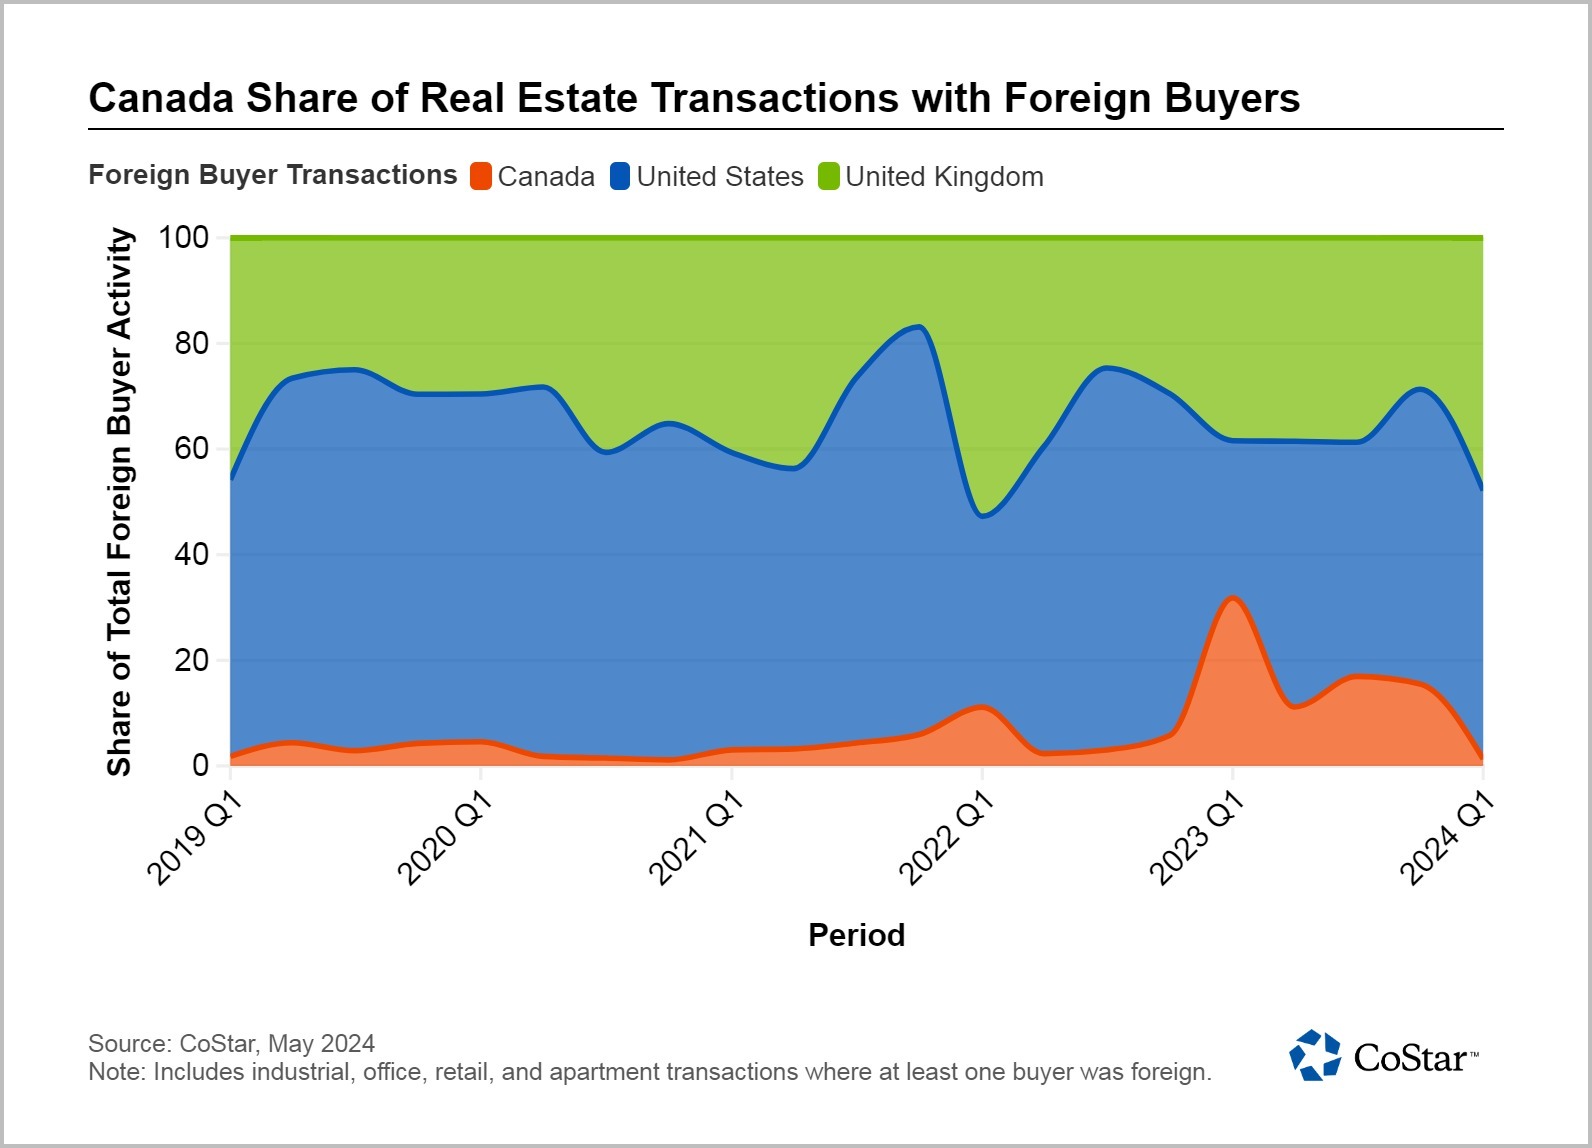
In absolute terms, Canadian commercial real estate is still attracting a relatively small amount of foreign capital compared to the United States and United Kingdom. However, on a relative basis, Canada has been attracting more overseas investment than ever before — in a trend that may not last.
While Canada’s commercial real estate has been attracting greater foreign interest, recent moves to expand the capital gains inclusion amount, coupled with increasing levels of property taxes and fees, may weigh on foreign investor interest in the near future.
Canada’s share of total foreign buyer activity received a considerable boost in 2023 when the Government of Singapore Investment Corp. or GIC, a government-owned company assigned to manage Singapore’s sovereign wealth fund, teamed up with Dream Industrial REIT to acquire Summit Industrial Income REIT. The sizable deal closed in early 2023 for a price of CA$5.9 billion, or US$4.38 billion or £3.66 billion.
Foreign buyer activity continued with other real estate transactions occurring in a steady in-flow throughout the year, leading to robust levels in foreign buyer sales volumes. Most of these transactions focused on industrial purchases in the Greater Toronto Area.
On a relative basis, Canada accounted for nearly 1 out of 3 foreign-buyer transactions across the three countries in the first quarter of 2023, again largely thanks to GIC-Dream’s purchase of Summit. Yet even in following quarters, Canada accounted for 11% to 15% of all foreign-buyer transactions, considerably higher than in earlier quarters, where the country’s share tended to range between 1% and 5%.
There are several possible reasons for this increase. On a relative basis, Canadian property could be seen by investors as having more upside potential. For example, in Toronto, Canada’s largest industrial market, industrial rents are 21% less than those in Los Angeles, the largest industrial market in the U.S. This gives potential purchasers a longer runway to potentially increase rents.
Another reason could be the valuation of the Canadian dollar. Throughout most of 2023, for example, the Canadian currency was trading at over 1.34 per U.S. dollar, a rate that has historically been in the low 1.20s. This favourable exchange rate means Canadian assets were available to be purchased at a discount by foreign buyers.
In addition, Canada continues to be viewed as a relative island of stability in a global investment market increasingly beset by geopolitical strife and internal political problems. While not without its problems, Canada’s respect for the rule of law, contracts and property rights is higher than in many places.
However, it remains to be seen if this trend of higher foreign investment inflow will continue. Data in early 2024 shows that sales volumes — including purchases by foreign buyers — have gotten off to a slow start compared to the recent past. The government’s April 2024 decision to expand the capital gains inclusion from 50% to 66% may further dampen investor interest. Higher taxes and fees may also affect investment pro formas and could result in fewer deals getting done.
Retirement Home Giant To Sell Property to Developer With Plans To Convert It Into Apartment Units
Canadian retirement home leader Chartwell plans to sell a large Ontario operation located near its head office in Mississauga that the buyer plans to convert into apartments, the company announced in its most recent quarterly earnings report.
Chartwell resolved to close its nine-floor, 323-unit Heritage Glen facility at the end of July. The property did not attract the same level of popularity as most of Chartwell’s operations, attaining under 60% occupancy over the last few years, according to a statement.
“The property wasn’t well-suited to continue as a retirement home and when you look at the vacancy rate in the region of retirement homes versus multi-res, it made a lot of sense for everyone for it to be repurposed as multi-residential,” said Jonathan Boulakia, Chartwell’s chief investment officer, on the earnings call. The complex is located about a 15-minute drive southwest of Chartwell’s head office in Mississauga, Ontario.
Chartwell plans to sell the property to an undisclosed developer with plans to convert it into apartment units, a strategy that has become increasingly common among Canadian retirement homes as profit margins have declined while apartment rents have soared. Details of the pending deal have not been finalized, Boulakia said on the call.
In a second deal, Chartwell said it will sell its 224-bed Ballycliffe project at 70 Station St. in Ajax, Ontario, for $64.5 million. The sale is part of a portfolio of 16 long-term care homes Chartwell sold to Axium and AgeCare Health Services in September for $442.2 million. The deal saw Chartwell part with 2,418 beds at the time while committing to sell the Ballycliffe property at a later date.
Chartwell is one of Canada’s largest retirement home chains with 175 properties in four provinces overseeing 25,000 residents. Chartwell is completing a significant portfolio split with U.S.-based Welltower that is expected to be made final sometime in the second quarter. Chartwell’s split with Welltower will see it close out 23 shared operations, while Chartwell emerges with 16 properties from the partnership, as well as a payment of $97.2 million.
Chartwell has a partnership agreement with Quebec-based builder Batimo that obliges Chartwell to purchase a Batimo-built property when it attains a certain occupancy level. The deal will result in Chartwell buying up one more retirement home facility that has yet to be identified. Chartwell also plans to dispose of another non-core property, it revealed during the call.
Many Canadian retirement home operations have hit rough waters in recent times as labour costs and other expenses have risen fast. Chartwell announced a $2 million loss in the first quarter of 2024, but the loss is far less dire than the $9.3 million hit it took in the same quarter one year earlier.
Chartwell credited lower labour expenses for the improved results, noting that management reduced staffing agency costs by 60% and also had success with a new bonus recruitment referral program, while also actively recruiting retired nurses and recent graduates and immigrants. The firm also credited a new electronic health record system for helping to lower its operating costs.
Increasing Office Availability an Indicator of Higher Vacancy Set To Come
Although often used interchangeably, there are key compositional differences between vacancy and availability rates, differences that can help shed light on where a market is heading.
The definition of vacancy is very straightforward, it’s the sum total of space that is currently unoccupied and available for lease. Availability is a bit more nuanced. It includes both vacant space and also space that will be coming to the market within a defined period, generally within 30, 60 or 90 days.
This may include upcoming lease terminations without intention to renew, space available for sublease and space in newly developed buildings that have not been pre-leased. This is generally why availability rates are higher than vacancy rates.
The spread between vacancy and availability rates will naturally fluctuate as tenants churn and reassess their requirements for space and as new offices are developed. This is nothing new, and part of the value brought by good asset managers as the spread can be converted into opportunity, particularly in a market with rising office demand.
However, in the current market where demand for office space is dwindling the increase in availability is being driven not so much by new building deliveries but rather by the large number of occupiers looking to exit their existing lease agreements.
In the first quarter of 2019, the vacancy/availability spread for the Toronto office market was 2%. Since then the spread has more than doubled and is currently at 5%. In 2019, the amount of space available through sublease accounted for 12% of availability. It has now grown to 18% as sublets are a material portion of the increase in available space.
Under these circumstance, the spread between the vacancy and availability rates can be used to predict upcoming vacancy and the increased costs that accompany it.
For landlords, there is one key difference between the two metrics. Vacancy comes with costs, like maintenance and insurance. Availability does not. A tenant’s attempt to sublet space does not void their obligation to cover the associated expenses. This being the case, vacancy is often the focal point for landlords.
As the above chart illustrating available square footage at various periods within the Greater Toronto office market clearly shows, the amount of available office space has been increasing across the region. Furthermore, the portion of space that is available through sublease is growing at a faster pace.
What is particularly noteworthy is how the spread patterns from previous timeframes play through to subsequent timeframes in forecasting future vacancies. The current metrics indicate office vacancy increasing in urban markets at a faster rate than in the central business district.
Availability is the doorway through which vacancy, and the higher costs that accompany it, arrive.
RioCan, Rival First Capital Foresee Shortage Affecting Store Expansion Plans
RioCan Real Estate Investment Trust, Canada’s oldest property investment company, said available retail space is increasingly in short supply and its executives are betting that the nation’s biggest population growth in almost 70 years and other market conditions will play to its strengths.
Jonathan Gitlin, president and chief executive of RioCan, discussing the firm’s earnings with analysts on a conference call Wednesday, said that the dearth of new retail supply comes at a time of substantially increased immigration into Canada, especially in the country’s six largest markets where RioCan is focused.
“This has put us in a position to fuel long-term organic growth,” said Gitlin on the call.
The high-demand retail results for RioCan were echoed in comments from its rival First Capital REIT, after Statistics Canada reported the nation’s population grew 3.2% in 2023, the highest rate since 1957. That growth is expected to drive retail demand.
Gitlin said the REIT is focusing on necessity-based tenants such as grocery operators, a business type RioCan considers to be a more stable tenant base. The REIT said 87.9% of its 33 million-square-foot portfolio is rented to what it calls stable tenants.
RioCan said it has been able to bounce back quickly from recent bankruptcies by such retailers as Bad Boy and Rooms + Spaces, with only four of 10 stores vacated by those former retailers still to be leased.
Sam Damiani, an analyst with TD Securities, noted that retail occupancy hit turbulence in the quarter but said there are clear skies ahead for the REIT.
When it comes to the bankruptcies, “already, six of them are released, including to grocers, at significantly higher rents, and most others are under negotiation,” said the analyst in a note. “The 2024 guidance reiteration is encouraging.”
The REIT has also added a Costco through a land lease at its RioCan Centre Burloak in Oakville southwest of Toronto. That deal is subject to certain closing conditions.
“Obviously they didn’t have another property in that area that is viable,” said Gitlin. “For us, it was an opportunity to take an oversized power centre and bring in an exceptional tenant that will draw a tremendous of traffic to the centre. It takes away a significant amount of risk not having these medium and smaller boxes. Anytime you can have a Costco, it makes for a tremendous co-tenant.”
In an outlook for 2024, Marcus and Millichap noted tenants were quick to expand their space when given the opportunity last year.
“Supported by a healthy job market and record-high population growth, consumer spending in Canada continued to increase last year despite rising interest rates,” the real estate company said. “Leasing demand remained robust as a result, outpacing an increase in completions.”
First Capital, also pointed to a shortage of retail space during its own earnings conference call and said the shortage of suitable space could ultimately impact plans from some retailers.
“The reality is when you go down the list of retailers, looking for space in Canada and what their store expansion plans are, and you look at the available space, and what’s likely to be built, it’s very obvious not everyone’s going to achieve their store expansion plan. So that’s obvious to us. It’s obvious to retailers. So they’re coming to us earlier,” said Adam Paul, chief executive of the REIT, on a call with analysts.
“They’re being more flexible in the type of space that they’re looking to lease, whether it be size, dimensions, column spacing, the way loading works. It used to be certain retailers were very committed to finding space that fit one of several kinds of predetermined prototypes for themselves. We’re seeing those same retailers look at space that’s well outside those prototypes.”
Country’s Biggest Pension Fund Heads to New Toronto Building
The country’s largest pension fund has agreed to one of the biggest office leases since the pandemic hit, a deal that calls for the Canada Pension Plan Investment Board to relocate to a new Toronto tower.
People close to the deal confirmed to CoStar News an Avison Young report that CPPIB is leasing 330,000 square feet in the second tower in CIBC Square at 141 Bay Street. The 50-storey tower is a development project by Montreal-based Ivanhoé Cambridge and Houston-based Hines that broke ground in 2021 and is set to open in 2025.
Carl Gomez, chief economist and head of market analytics for Canada for CoStar, said in the current office market, more tenants appear to be more likely to consider newer, high-quality space.
“There is more nuance to” the so-called flight-to-quality trend often cited in real estate circles since the pandemic hit, he said. “While availability rates in top-rated towers have held up better than in lower-class buildings, a bigger shift has been from old to new,” he added. “This mammoth lease is a classic reflection of that.”
Officials with CPPIB, overseeing $590.8 billion in assets under management at year-end, wouldn’t comment on the deal. The pension fund has about 1,600 employees in Toronto, where its current head office is in a building it owns at 1 Queen Street East.
A boost for the office market could be coming at the right time for Toronto. Avison Young said the availability rate reached 19.5% in the first quarter, up from 19.3% in the fourth quarter.
“The lack of new project announcements in recent years has resulted in the supply pipeline tapering off as projects are completed,” the Avison Young report stated.
Location Shift
Of the 13 office buildings under construction across the Greater Toronto Area at the end of the first quarter, five were located in the suburbs, Avison Young said, two were in Toronto East, two in Toronto North and one in Toronto West, with these projects combined accounting for 20% of the total square footage under construction in the Greater Toronto Area.
That compares with just 6% in the first quarter of 2020, when the downtown market’s construction pipeline represented a much larger share, Avison Young’s report said.
The CPPIB deal was easily the largest office lease of the quarter in Canada’s largest city, with Invesco’s 66,800 lease renewal at 120 Bloor Street Street East second, according to Avison Young.
Canadian Natural Resources signed the biggest lease since the pandemic hit when it agreed to take 702,000 square feet at 400 4th Ave SW in Calgary in December 2023, according to CoStar data.
Ivanhoé Cambridge officials could not be reached for comment, but a previous release noted CIBC as the lead tenant for the 3 million-square-foot CIBC Square. The second tower is 1.5 million square feet.
JLL also noted the CPPIB transaction in its first-quarter report on the Toronto market. The real estate company termed the deal a relocation.
“As the office construction pipeline dwindles to near-zero by 2027, relief for landlords could be on the horizon. Meanwhile, the divergent fortunes of higher-quality buildings and commodity buildings will widen as declining occupancy and mounting financing costs weigh on the latter. As the city focuses on generating more housing, there may be a shift in zoning policy away from office and toward residential redevelopment to facilitate this transition,” JLL noted in its report.
Property’s Total Value Expected To Reach $386 Million
Equiton said it bought a development site in Toronto for its third condominium development project in the city.
The Toronto-based company that has just over $1 billion in assets said it bought the site at 1099 Broadview Avenue for its newest project, to be called TEN99 Broadview. It would be Equiton’s largest condo offering to date.
“The property’s desirable, transit-oriented location is a stone’s throw away from some of Toronto’s best green spaces,” Jason Roque, founder and CEO of Equiton, said in a statement. “Coupled with the local amenities, it’s ideal urban living.”
Established in 2015, Equiton has more than 12,000 investors, and nearly 200 employees. The firm manages 39 properties that contain 2,752 units in 17 regions nationwide.
The company’s latest project expects to have occupants move in by late 2028. Upon completion, the property’s total value is expected to reach an estimated $386 million, providing a targeted annual return of 20%, the development team said.
Last quarter, Equiton Developments launched registrations for KüL Condominium at 875 The Queensway, west of downtown Toronto. In addition to the three projects in Toronto, the company has existing developments in Ottawa and Guelph.
TORONTO – An analysis of 12 of the largest Canadian commercial real estate markets shows developers have shifted their focus toward purpose-built rental construction, some at the expense of new residential condominiums and commercial buildings.
Re/Max Canada’s 2024 Commercial Real Estate Report, which examined the dozen markets during the first quarter of this year, said multi-family and industrial real estate were the top-performing asset classes in all cities.
It said the federal government’s decision to cancel the GST on new residential builds has spurred the construction of purpose-built rentals, which were the primary focus in every major urban centre analyzed, followed by student housing and seniors’ residences.
Landlords of malls and strip plazas have also been increasingly exploring a residential component amid a push for more density, signalling a “clear trend toward future mixed-use developments.”
But due to Canada’s growing population, which now tops 40 million people, the efforts to boost residential construction are still not enough, said Re/Max Canada president Christopher Alexander.
“Even the current upswing in residential construction continues to fall short of the thousands of units required in most major markets,” he said in a press release.
Among other findings included in the report, it said neighbourhood retail is performing well, despite the popularity of e-commerce, thanks to a shift toward service-focused stores from those selling goods such as clothing.
It also highlighted trends such as a hospitality industry that “has roared back to life” in many regions, and strong demand for industrial real estate across Canada.
But the office sector in downtown cores continue to struggle, with rising vacancy rates in almost all markets across the country.
Conversions of office space have been repurposing that real estate for other needs, including much-needed housing, helping to remove some excess space from the market. But the report cautioned this is not a fix-all solution.
“Conversions are complex and most buildings are not suited to the process,” it said.
“Business Improvement Areas and municipal plans to revitalize downtown areas and attract foot traffic will play a role in reviving core areas. Residential development is certainly helping and improving demand for retail/services as a result.”
Alexander said a variety of factors will drive future trends affecting the Canadian commercial real estate market, including economic performance, interest rates, incentives and development policies, tax policies and more.
“Diverse market dynamics exist, but overall improvement is expected to characterize conditions and demand as 2024 progresses,” he said.
This report by The Canadian Press was first published June 6, 2024.
InnVest Hotels’ $410 Million Purchase of 14-Property Portfolio Marks Quarter’s Largest Deal
The Courtyard Marriott near Pearson International was part of a 14-property portfolio deal. (CoStar)
This article was updated on May to clarify the landlord and tenant representatives in the Thales Canada lease deal.
The $410 million purchase of a portfolio of 14 hotels by InnVest Hotels from Morguard Corp. was Canada’s largest real estate transaction during the first quarter, making it one of the top deals recognized in the latest CoStar Power Broker quarterly awards.
Toronto-based Morguard first announced the deal to sell the portfolio in late 2023, and the deal closed on Jan. 18, 2024.
“The successful conclusion of this deal is a testament to the appeal of our hotel portfolio and the strength of Morguard’s management over the years,” said K. Rai Sahi, chairman and chief executive of Morguarad, in announcing the deal. “We are pleased to have capitalized on the current market demand for high-quality hotels.
The transaction included Courtyard Marriott and the Residence Inn Marriott in Markham, the Courtyard Marriott, Hilton Garden Inn Toronto Airport West and Cambridge Suites in Mississauga, the Holiday Inn Express in Ottawa, the Towne Place Suites by Marriott in Sudbury, the Courtyard by Marriott Toronto Airport, Hotel Carlingview Toronto Airport and Residence Inn by Marriott in Toronto, the Courtyard Marriott in Vaughan and the Cambridge Suites Hotel and the Prince George Hotel in Halifax.
InnVest sold four hotels from the portfolio to the Manga Hotel Group on the same day.
George Kosziwka, chief strategy officer of InnVest Hotels, at a hotel conference in February shared insight on the sale process that involved four rounds of bids. He said InnVest’s in-house renovation team is strategically positioned to revitalize the properties.
Listings brokers on the deal from CBRE included Luke Scheer, executive vice-president of hotels, Mark Sparrow, head of alternative assets and Ryan Tran, vice-president of alternative assets.
Here are some of the other top deals that posted during the first quarter:
Top Office Lease
Thales Canada Signs Lease in Suburban Ottawa
The largest office lease of the quarter was in suburban Ottawa. (CoStar)
The first quarter’s top office lease was in Ottawa’s west market, where Thales Canada signed a 128,051 square foot office lease at 500 Palladium Dr.
Thales Canada, a company with annual revenue of over $800 million and a workforce of more than 2,500 employees coast to coast, signed the lease on March 25.
The deal kicks in on Feb. 1, 2025 and covers 45% of the 293,121-square-foot building owned by Pro Real Estate Investment Trust.
The leasing representatives on the deal was Alain Desmarais and Peter Rywak of Cushman & Wakefield, while the tenant representative was Doug Tilley, also of Cushman & Wakefield.
Top Retail Lease
Blue Sky Supermarket Snaps Up Location East of Toronto
The 10-year lease was signed on Jan. 1, with a move-in scheduled for June 1. (CoStar)
The top retail lease of the quarter was for a supermarket just east of Toronto in Oshawa, where Blue Sky Supermarket signed a 22,790-square-foot lease at 1150 Simcoe St. N.
The grocery store, which focuses on Asian cuisine, opened its first store in North York in 2007 and later expanded into Pickering.
The 10-year lease was signed on Jan. 1, with a move-in scheduled for June 1.
Steve Babor of Sitelines Realty Inc. was the leasing representative on the deal. Arthur K Miu of Global Kink Realty Group Inc. was the landlord contact.
Top Industrial Lease
Glovis Canada Signs Lease in Brampton
[Glovis Canada Inc. signed a lease for industrial space northwest of Toronto in Brampton. ] (CoStar)
Glovis Canada Inc., a logistics company, signed a lease in the first quarter for a 200,519-square-foot warehouse in Brampton northwest of Toronto, a deal selected as the top industrial lease of the quarter.
The Canadian logistics firm began operations August 2009. GCI was established to provide Hyundai Glovis’ expertise in logistics and synergy in operations to its Canadian counterparts, Hyundai Auto Canada Corp. and KIA Canada Inc.
The company’s lease deal at 35 Automatic Road, signed March 25, has a starting rent of $22 per foot and is for seven years. The lease begins on May 1.
Kyle Hanna and Even White of CBRE were the leasing representatives on the deal. The landlord contact is Brandon McIntee of New York-based Blackstone Inc. The tenant representatives on the deal were James Min, Colin Alves and Graham Meader of Colliers.
At TorontoCommercialProperties.ca, we’re dedicated to keeping you informed about crucial developments that could affect your commercial real estate investments. One such development is the recent increase in Canada’s capital gains tax and its potential impact on the real estate market.
The Canadian government’s decision to raise the capital gains tax has stirred discussions and raised concerns among investors. This hike, affecting individuals with taxable capital gains, may influence investment decisions in the commercial real estate sector.
Here’s a closer look at how this tax hike could affect commercial real estate investment:
Shift in Investment Strategy: Investors may reconsider their investment strategies in response to the higher capital gains tax. With increased taxes on capital gains, investors might seek alternative investment options that offer more favorable tax treatment. This shift could lead to a redistribution of capital away from real estate and into other asset classes.
Impact on Market Dynamics: The hike in capital gains tax could potentially alter market dynamics in the commercial real estate sector. Some investors may decide to hold onto their properties longer to defer the realization of capital gains and mitigate the impact of higher taxes. This behavior could reduce the supply of available properties in the market, leading to increased competition among buyers.
Effect on Pricing: The increase in capital gains tax may also have implications for property pricing. Sellers may factor in the higher tax burden when pricing their properties, potentially leading to adjustments in property valuations. Moreover, buyers may negotiate lower purchase prices to compensate for the anticipated increase in tax liabilities.
Regional Variances: It’s essential to consider regional variances in the impact of the capital gains tax hike. In markets like Toronto, where commercial real estate values have traditionally been strong, the effect may be more pronounced compared to other regions. Investors should closely monitor market trends and assess the specific implications for their investments in different geographic areas.
Long-Term Outlook: Despite the short-term uncertainties resulting from the capital gains tax hike, the long-term fundamentals of the commercial real estate market remain strong. Factors such as population growth, urbanization trends, and economic development continue to drive demand for commercial properties. Investors with a long-term perspective may view any market fluctuations as temporary and maintain confidence in the resilience of the real estate sector.
In conclusion, while the increase in Canada’s capital gains tax may introduce new considerations for commercial real estate investors, it’s essential to approach investment decisions with a comprehensive understanding of the potential implications.
At TorontocommercialProperties.ca, we’re committed to providing you with insights and guidance to navigate the evolving landscape of commercial real estate investment. Stay informed, stay proactive, and position yourself for success in the dynamic real estate market.
Whether you’re seeking investment opportunities, looking for development land, or market analysis, our team is here to assist you every step of the way.
Don’t hesitate to reach out to us for personalized advice and support in navigating the evolving landscape of the commercial real estate market. Contact us today to discuss your commercial property needs and discover how we can help you.