CRE Measures Up as Canadian Economic Driver

CRE Measures Up as Canadian Economic Driver
Commercial real estate (CRE) is a Canadian economic driver on par with the oil and gas industry, economic analysts conclude. A new report, commissioned by the NAIOP Research Foundation, estimates CRE made a $148.4 billion total contribution to Canada’s gross domestic product (GDP) last year when factoring its direct, indirect and induced impacts, beginning with $78.2 billion of direct GDP output and nearly 373,000 equivalent fulltime jobs within the industry.
That’s derived from six envelopes of economic activity: construction and capital investment in each of the office, industrial, retail and multifamily asset classes; property management and operations within existing CRE inventory; and commercial brokerage services tied to leasing and asset transactions. Researchers with Altus Group Economic Consulting also considered how social and economic trends might affect each of those elements of CRE’s multifaceted whole.
“The commercial real estate sector could be vulnerable to long-term impacts related to the (COVID-19) pandemic such as the demand for office space that will continue to evolve with hybrid work practices and the demand for retail and industrial space that will continue to evolve with shifts in e-commerce trends. High inflation and rising interest rates have also increased costs for new commercial real estate development,” the report notes. “Notwithstanding these risks, non-residential investment is generally holding up and leasing activity related to new buildings is robust.”
Among the CRE asset classes, industrial and multifamily are the predominant economic engines, together accounting for 68 per cent of direct investment in new construction and about 55 per cent of direct investment in renovations and retrofits. On the job front, that translates into 60 per cent of the person years of employment that construction supported in 2021.
More than $16 billion invested in industrial construction last year continued a five-year growth trend in the sector and created 60,630 direct jobs. On the transaction side of the equation, about $16.7 billion worth of deals was a 92 per cent year-over-year increase and accounted for more than 37 per cent of CRE sales value in 2021.
Even more investment went into multifamily construction — exceeding $24 billion — representing 37 per cent of construction spending for the year and directly employing 90,760 workers. Investors also acquired about $13.2 billion worth of multifamily apartments, equating to more than 29 per cent of CRE sales value for the year.
Adding in $12.8 billion in the office sector and nearly $11.8 billion in the retail/hospitality sector, new construction and renovation/retrofit spending surpassed $65 billion in 2021. That was weighted about 55 per cent in favour of new construction, but office stands out for a greater share of renovation/retrofit activity occurring within existing inventory — equating to more than $8 billion in investment.
“Office construction is highly skewed toward renovation/retrofit because of the important contribution of tenant improvements,” the reports states. “The proportion of investment in new buildings has gradually increased since 2018, but will likely subside in the next few years. Post-pandemic trends may decrease the need for new office space at the same time as many office users find that adapting their spaces to emerging new working realities requires capital investment.”
That plays out in job numbers with 29,890 tied to office renovations and retrofits last year versus 17,590 in new office construction. In contrast, new construction generated nearly 115,000 jobs across the three other asset class compared to 80,000 related to renovations and retrofits.
Commercial brokerages enjoyed a 20 per cent year-over-year lift in fee collection last year. Nearly $9.5 billion in earnings — up from $7.9 billion in 2020 — also marked a five-year high. Fees hovered in the $8.1 billion range in 2018 and 2019 and tallied about $7.3 billion in 2017.
“Broker fees are typically generated based on transaction volumes, and the rise in broker fees in 2021 is related to the strong recovery in the number of transactions,” the report advises. That was seen in a 67 per cent year-over-year increase in total sales value, which rose from $26.5 billion in 2020 to $44.5 billion in 2021. Meanwhile, brokerage operations accounted for 48,670 jobs last year.
Management and operations of the existing inventory encompasses the multidisciplinary tracks of property and asset management, involving building operations, finance and investment and tenant-facing pursuits. It is proportionally the biggest spender among the six categories of CRE activity, supports the most employees and makes the heftiest contribution to GDP, which represents the final value of goods produced and services rendered. For 2021, that’s about $72.3 billion in direct spending, $46.3 billion in direct GDP and 81,580 direct jobs.
Compared to construction or brokerage services, property and asset management have a disproportionately positive influence on employment in other sectors from which products and services are procured. That’s estimated at 219,430 indirect jobs — a multiplier effect of nearly 2.7 — representing slightly more than half of all indirect employment attributed to the CRE industry. That flows through to $13.58 billion in indirect labour earnings and nearly $21.5 billion in indirect GDP.
Property/asset management actually spurred better paying indirect jobs, at an average of $61,887 per worker, than within the CRE sector. Looking at direct jobs, average per worker earnings in 2021 were $79,600 in construction/renovation versus $56,877 in management and operations.
CRE construction generated roughly 181,000 indirect jobs or 75 per cent the amount of direct jobs. That represents $12.94 billion in labour earnings or an average of $71,484 per worker.
Source REMINetwork. Click here to read a full story
Leave a Reply
Leave a Reply
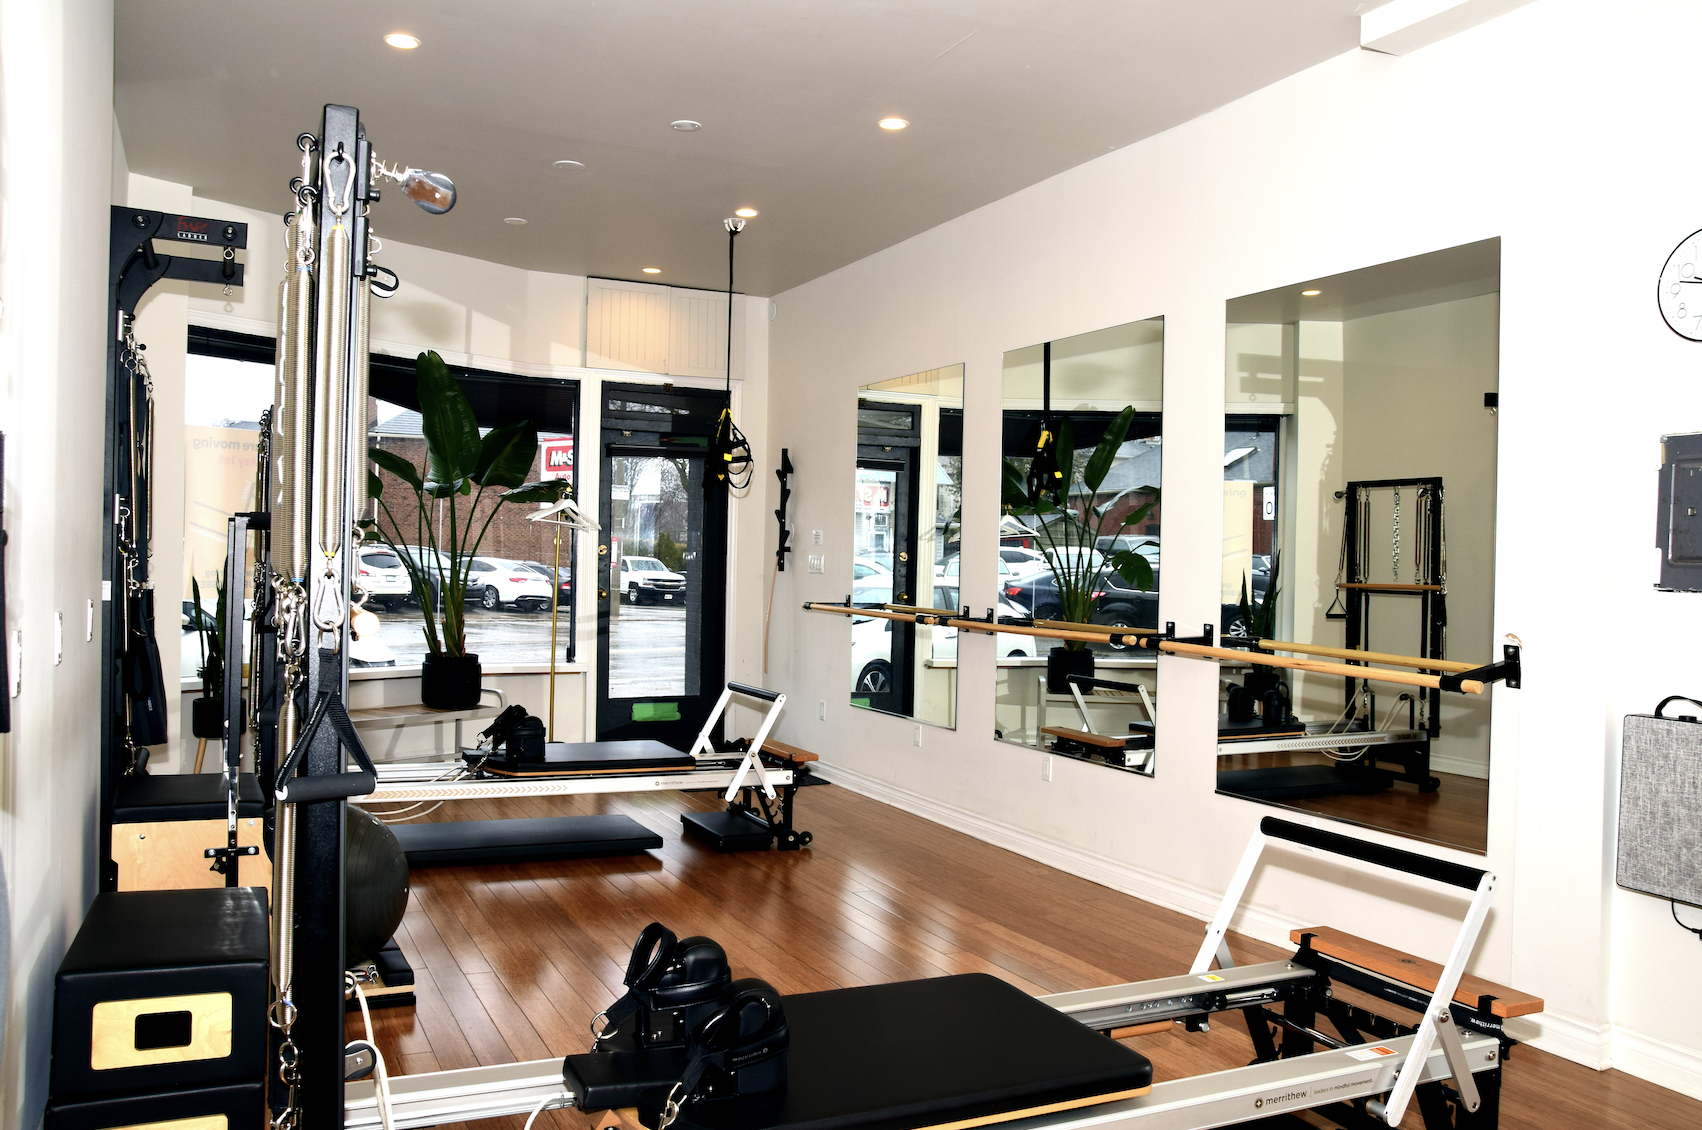
FOR LEASE – Retail Space – Toronto
Available area: 595 SF Lease rate: $1,800.00 Net Lease Located in Toronto’s upscale Leaside ne ...
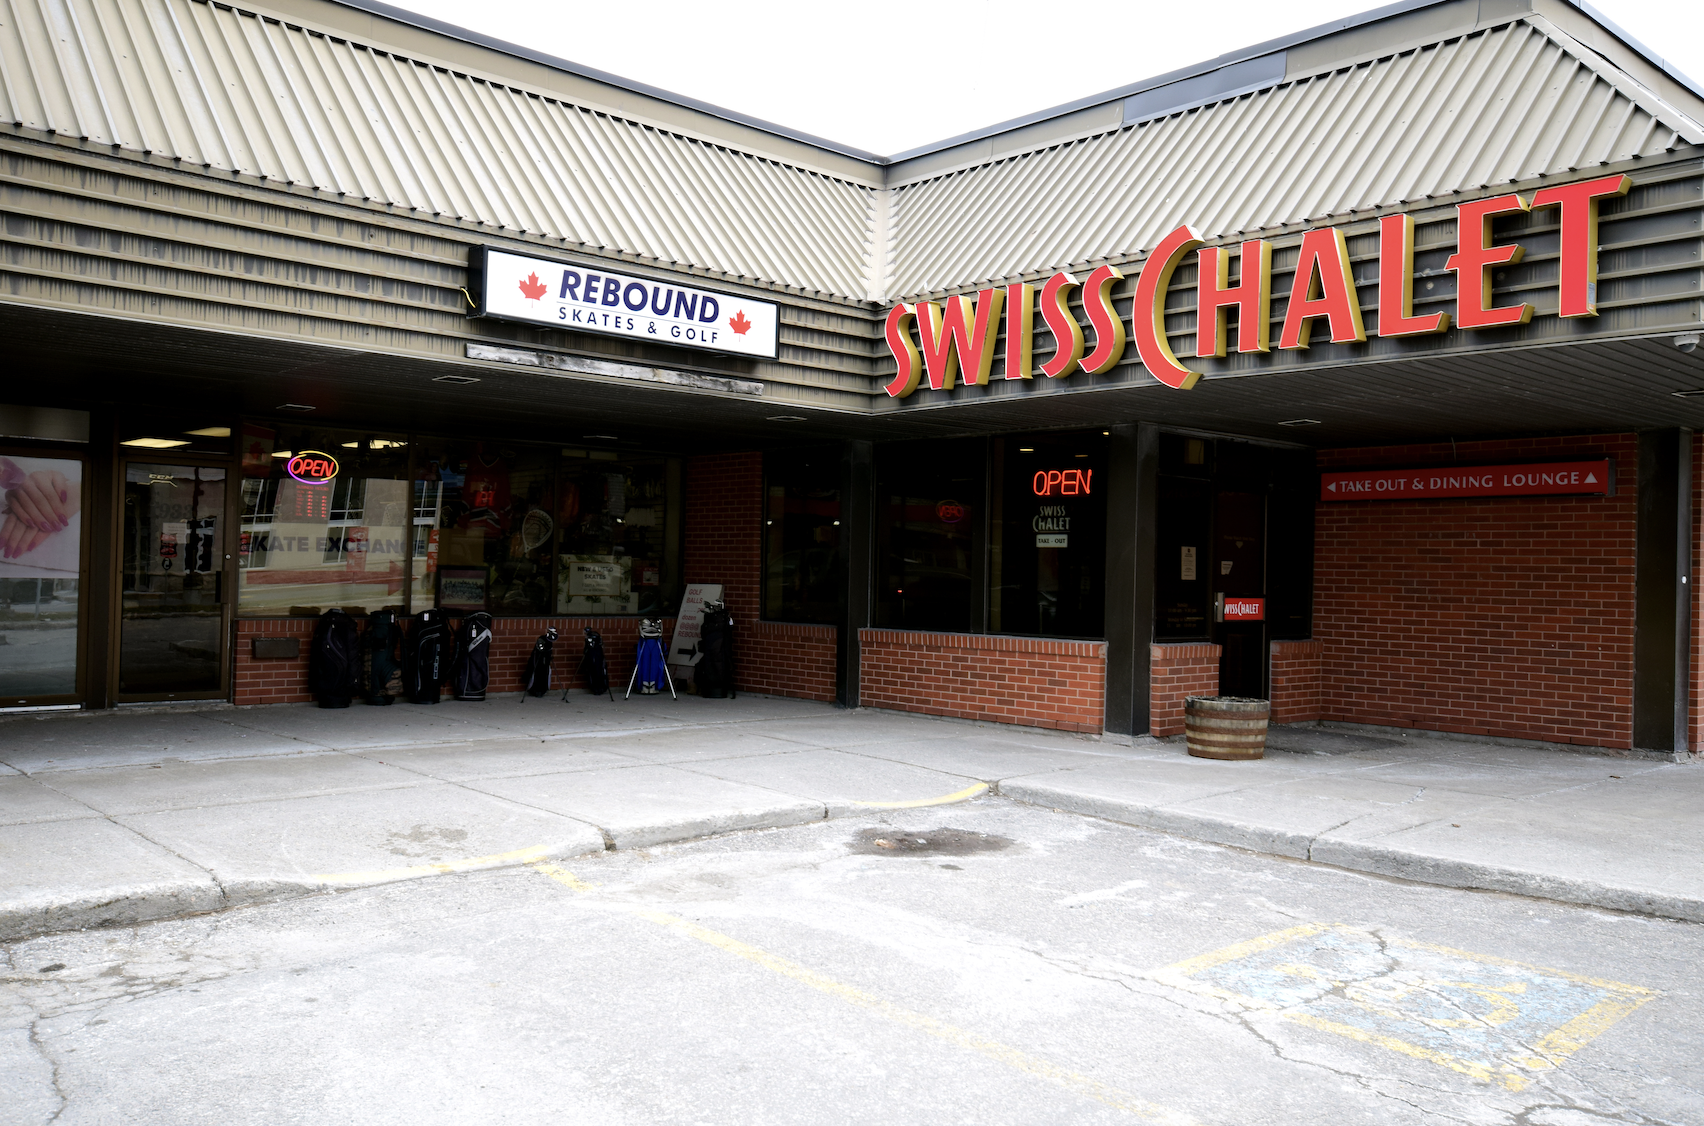
BUSINESS FOR SALE – Sports Equipment Shop – Peterborough
Available area: 783 Sq Ft Asking Price: $300,000.00 An exclusive business opportunity awaits in Pete ...
FOR LEASE – Office Space – Toronto
Available area: 1,124 SF Lease rate: $17.00 Net Lease Perfectly located near the 401 with easy trans ...
FOR LEASE – Office Space – Toronto
Available area: 755 SF Lease rate: $1,800 Gross Lease CLICK HERE TO DOWNLOAD THE BROCHURE Prime Scar ...
FOR LEASE – Office Space – Toronto
Available area: 638 SF Lease rate: $1,700 Gross Lease CLICK HERE TO DOWNLOAD THE BROCHURE Prime Sc ...
FOR LEASE – Office Space – Toronto
Lease price: $23.50 Sq Ft Net + $17.68/2023/T.M.I. Available area: 3,901 Sq Ft 1,820 Sq Ft Elevate y ...
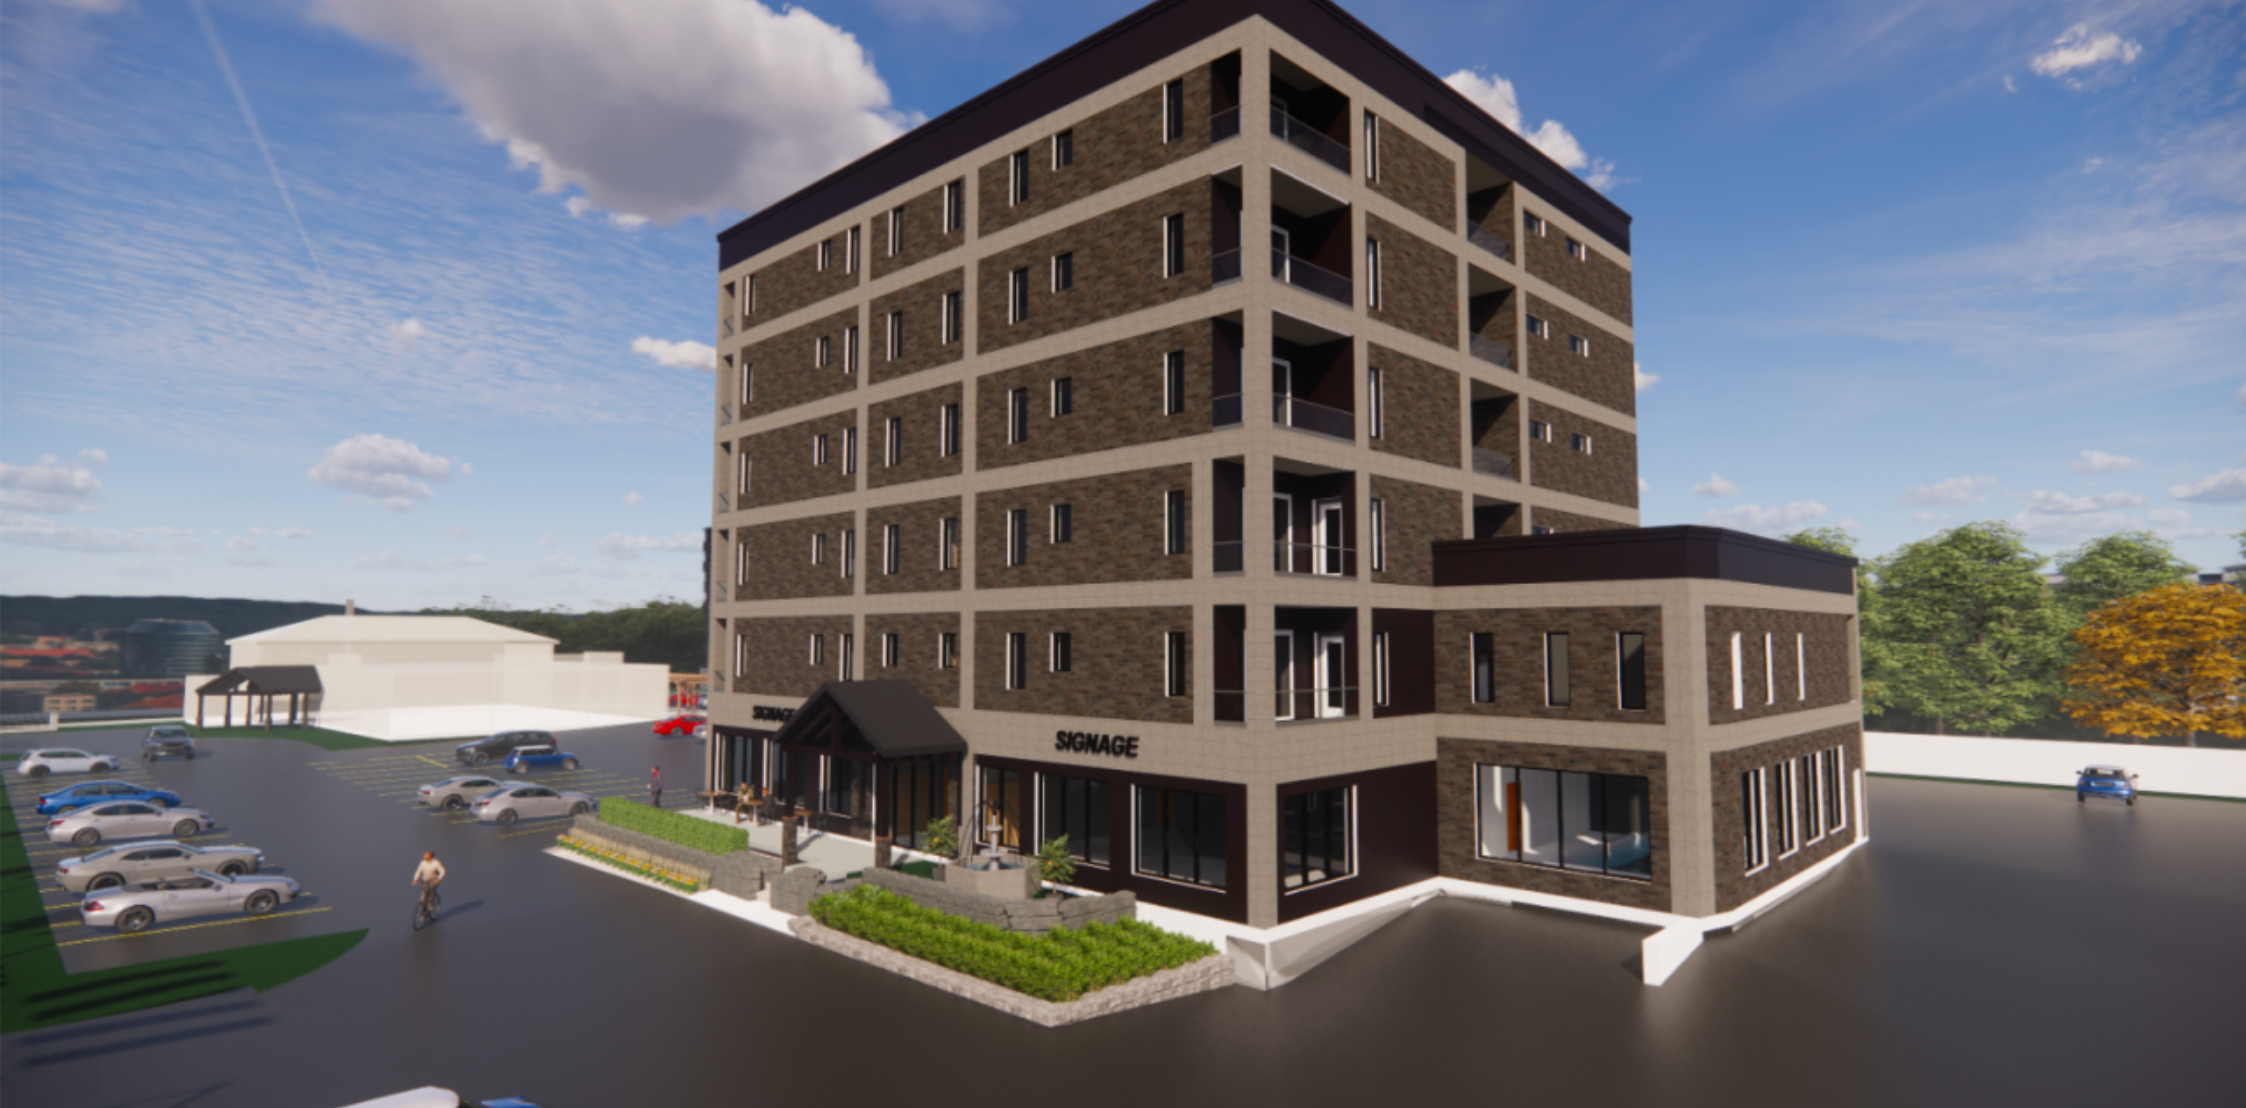
FOR SALE – Development Site – Woodstock
Size: 0.9 acres The two building lots are designed to be mixed-use, with commercial spaces on the gr ...
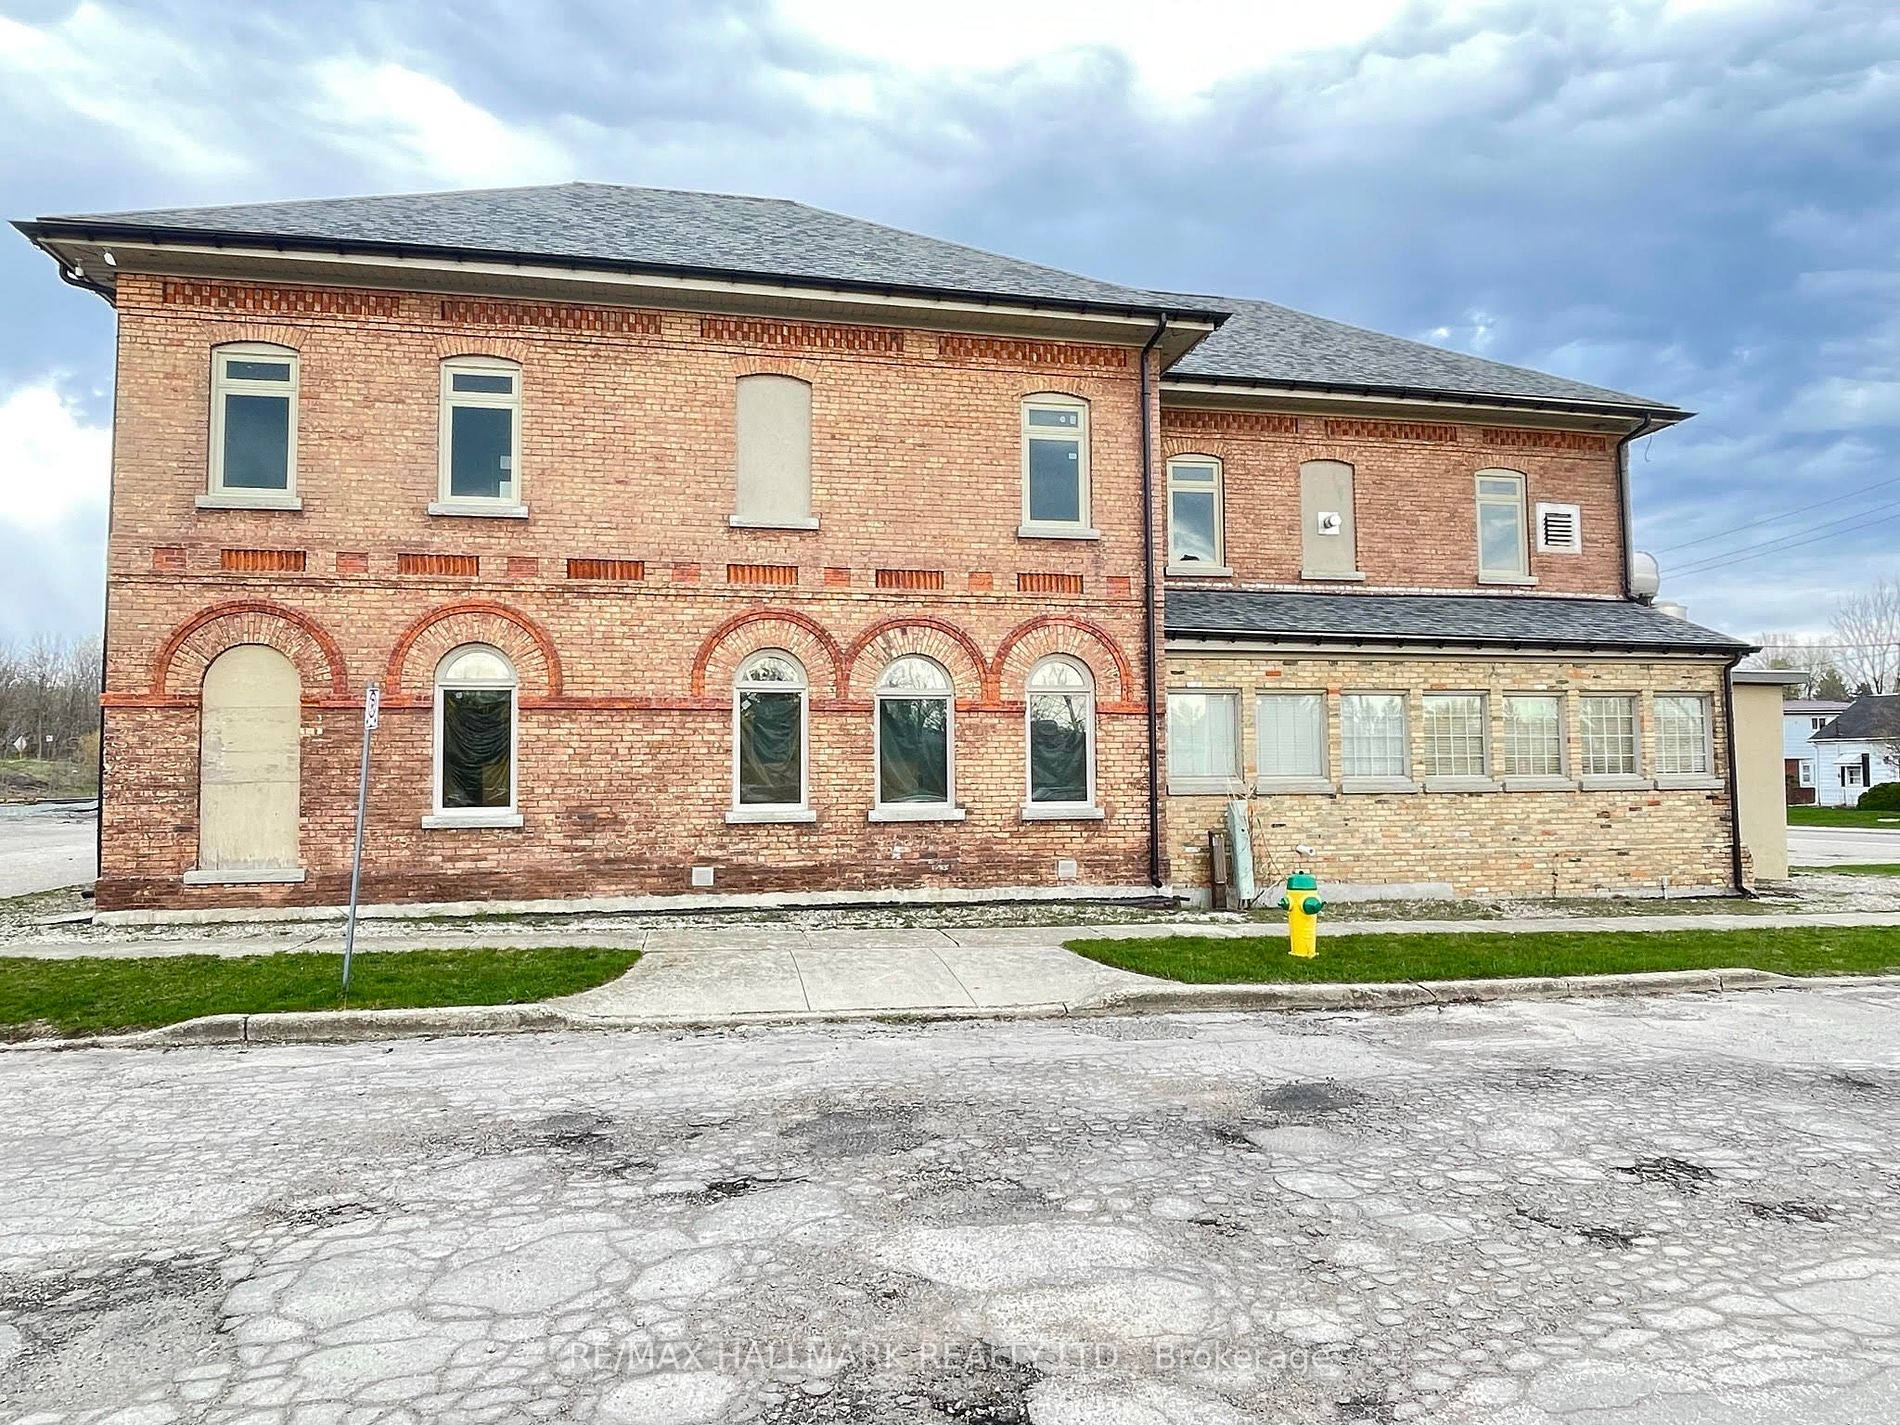
FOR SALE – Development Site – Woodstock
Size: 1.14 acres Currently has a commercial building whihc is built out for Resteraunt/Banquethall/ ...
![]()
Toronto Commercial Properties
Stephen & Mariya Lilly
Brokers
Office: 416-494-7653
Mariya Cell: 416-824-5078
Stephen Cell: 416-802-4228